Image Processing Reference
In-Depth Information
the trout. Its high is proportional to the canalization base length to avoid extra data to be cap-
tured.
3 Statistical Measuring Approach
In this section, we present our statistical approach to measure rainbow trout.
Considering the rainbow trout natural swimming movement against the water flow and ob-
serving the trout from a downward point of view, we hypothesized that a
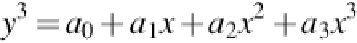
third- order curve
could approximate the trout's body within the water.
Diferent procedures can be followed to obtain a third-order curve equation. However, we
prefer a simple but effective solution that could be executed online after a trout's image is cap-
tured.
Then, given
n
sample points (
x
,
y
) which depict the trout body, we apply minimum squares
(1)
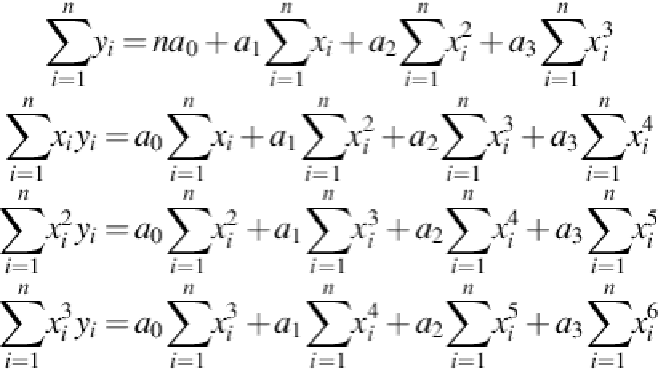
where
a
0
,
a
1
,
a
2
,
a
3
are constants that gain their values by solving the [4 × 4] equation system
(2)
:
(2)
The equation system
(2)
can be easily solved using the matrix notation,
AX
=
B
, or more spe-
ciically:
X
=
BA
− 1
.
After this computation, we obtained the best regression curve that adjusts the trout's body
captured into an RGB image.
Search WWH ::

Custom Search