Biology Reference
In-Depth Information
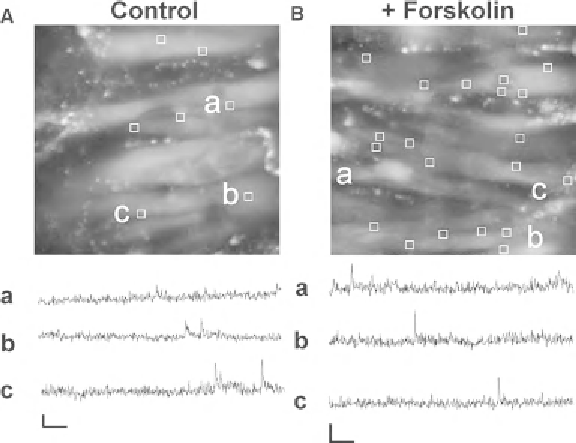
Fig. 5. Ca
2+
sparks in intact pressurized cerebral arteries. Ca
2+
sparks were recorded in
56
μ
m × 53
μ
m areas of intact pressurized mouse cerebral arteries in the absence (
a
) and
presence (
b
) of forskolin (10
μ
M), an activator of adenylyl cyclase. During a 10 s recording
period, a total of 13 Ca
2+
sparks were observed in the image depicted in
panel A
, and a
total of 38 Ca
2+
sparks were observed in the image depicted in
panel B
.
White boxes
represent sites where Ca
2+
sparks occurred. Three representative
F
/
F
0
records (
a
-
c
) cor-
responding to three Ca
2+
sparks sites (
a
-
c
) from each artery are displayed below their
corresponding artery image.
Horizontal scale bars
represent a time of 1 s, and
vertical
scale bars
represent a fractional fl uorescence (
F
/
F
0
) change of 0.5. From Wellman et al.
(
11
) with permission.
Although Ca
2+
concentrations can be estimated using non-
ratiometric Ca
2+
indicator dyes such as fl uo-4, using the equation:
[Ca
2+
] =
K
d
×
F
/(
F
max
−
F
) (
23
), given the
K
d
of fl uo-4 is »0.4
M,
this approach may underestimate local Ca
2+
concentrations attained
during Ca
2+
sparks. Other frequently reported spatio-temporal
characteristics of Ca
2+
sparks include spark size or area (defi ned as
the area measured at 50% peak amplitude), rise time (measured
from 10 to 90% rise in signal), decay time constants and half-time
to decay (
27
).
μ
4. Conclusions
In this chapter, we provide a description of procedures used to
assess both global and local Ca
2+
signaling in cerebral artery myo-
cytes using the Ca
2+
-sensitive fl uorescent dyes fura-2 and fl uo-4.
The ratiometric Ca
2+
sensitive dye fura-2 is considered the indicator
Search WWH ::

Custom Search