Biology Reference
In-Depth Information
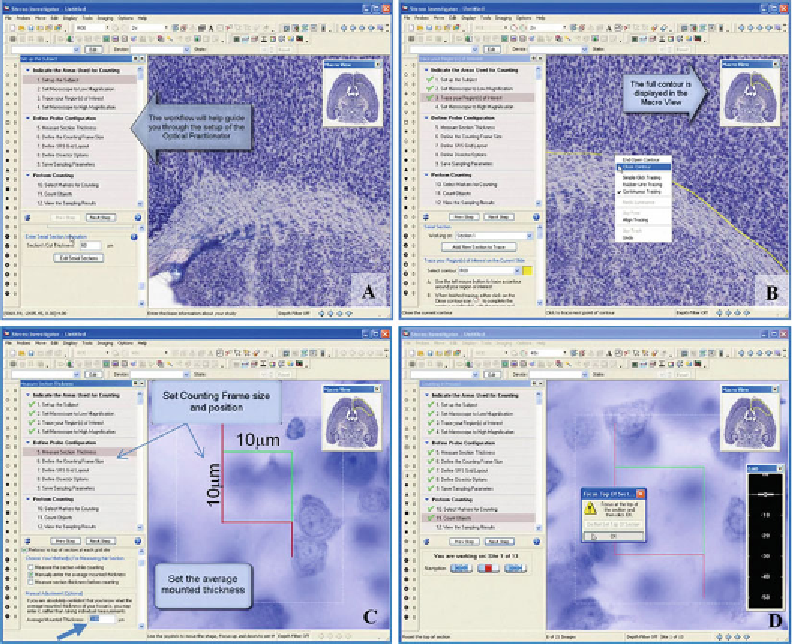
Fig. 4. The Optical Fractionator procedures in brief showing the Optical Fractionator Work Flow upon starting a new subject
(
a
). The contour of the ROI is traced (
yellow line
) at low power (
b
). The average mounted section thickness is entered
(
arrow
) and the size of the counting frame is defi ned at high power (
c
). Before starting to count at each new counting frame,
focus at the top of the section; this is zero on the focus position meter (
d
). (Reprinted with permission from Geoff Greene,
MBF Bioscience, Inc.).
within the region of your interest. The reference point should be
easy to identify, allowing the software to perform
parfocal and par-
centric corrections
when switching to high power. At low magnifi -
cation (usually ×1 to ×10), trace the contour of the area you desire
to sample. Anatomical or regional landmarks ensure the same area
is traced and measured in each section. The actual cytoarchitectural
ROI will be retraced on each subsequent section. On a two-button
mouse, right clicking brings up a menu and you can select
Close
contour
to end the tracing and close any gap between the begin-
ning of the trace and the end (Fig.
4b
). Switch to a high power
(×40 or ×100, 1.4 N.A. oil objective) on the microscope. For
brightfi eld work, it is critical to have the thinnest possible depth of
fi eld, requiring Kohler illumination and a fully open condenser
aperture as well.
Search WWH ::

Custom Search