Biology Reference
In-Depth Information
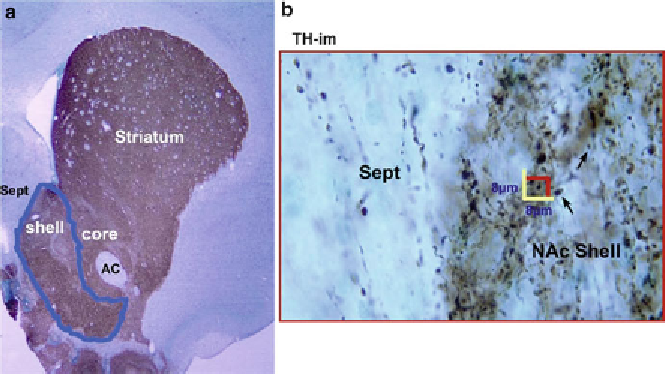
Fig. 2. Stereological analysis of dopamine (DA) terminals in the shell of nucleus accumbens (sNAc). The DA terminals
indicated by tyrosine hydroxylase-immunostaining (TH-im) are shown in the sNAc outlined using a computer-assisted
stereology program (MBF Bioscience, Inc.) (
a
). The program generates randomly sampled frames within the drawn boundary
(in
b
). The TH-im varicosities or
bouton en passé
(
arrows
) in the sampled frames were counted under a ×100 objective lens
(in
b
). The varicosities inside the frame or on the green line are counted, and the total number or the density of the terminals
is calculated according to the volume recorded.
AC
anterior commissure,
Sept
septal nucleus. Scale of frame: 8 × 8
m
m.
(From ref. (
4
) : Reprinted with permission from Elsevier).
regional boundaries of subdivisions in the extended amygdala due
to their innate expression. The heterogeneous distribution of
TH, vGLUT1, and vGLUT2 within a brain region rendered a
unique challenge for stereological sampling, but it emphasizes that
stereological analyses remain valid even though regional variation
exists in terms of intensity or distribution of the signals. Figure
2
reveals the heterogeneous distribution of TH+ terminals in the
shell of the nucleus accumbens, septum, and anterior commissure.
Heterogeneous distributions require more sampling for analysis
than a homogeneous distribution, for any given level of precision
in the fi nal estimate.
2.2. Combined
Analyses
Neuroscience methods may be combined to use some of the avail-
able options packages contained in many stereology software pack-
ages. Stereo Investigator features tight integration with the
Olympus DSU spinning disk confocal microscope (in addition to
many other microscope models, including Zeiss microscopes with
the ApoTome) and allows for easy acquisition of brightfi eld, wide-
fi eld fl uorescent, or multichannel fl uorescent image stacks. In a
study on retinal ganglion cell ocular hypertension, confocal images
stacks of
N
-methyl-d-aspartate receptor 1 (NR1) and glutamate
receptor 2/3 (GluR2/3) fl uorescent immunostaining were obtained
from confocal laser scanning microscope, quantifi ed using stereology,
revealing alterations in glutamate receptor expression (
5
). Additional
discussion on 3D volume analysis is available in Section
7
.
Search WWH ::

Custom Search