Biology Reference
In-Depth Information
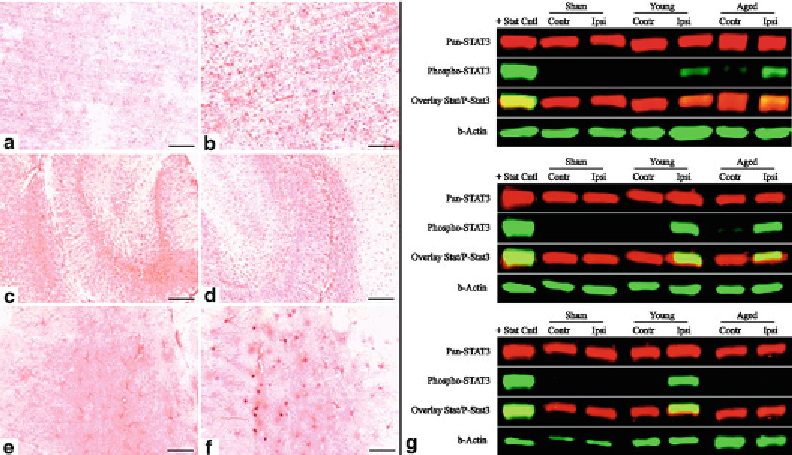
Fig. 3. MCAO induces reactive gliosis and nuclear translocation of STAT3 in astrocytes. At 24 h following MCAO in young
rats, enhanced immunostaining of GFAP-positive cells (astrocytes) was observed in ipsilateral cortex (
b
) compared to the
GFAP immunostaining observed in contralateral cortex (
a
). Basal GFAP immunostaining was observed in contralateral hip-
pocampus (
c
) that was enhanced in ipsilateral hippocampus (
d
). MCAO also resulted in the appearance of STAT3 immuno-
reactivity in astrocytic nuclei (
b
,
d
,
f
). (
b
)
Western blot analysis of STAT3 activation following MCAO in rodents.
At 6, 24, and
72 h following MCAO, STAT3, and pSTAT3 expression were evaluated quantitatively by immunoblot analysis. (DiNapoli et al.
2010).
Total RNA is isolated using Trizol
®
reagent (Invitrogen; Carlsbad,
CA). Concentration and purity of RNA was determined using a
biophotometer and considered for use only if A260/A280 was
between 1.8 and 2.1. Total RNA (1
2.5. RNA Isolation,
cDNA Synthesis,
and Real-Time PCR
Amplifi cation
g) is reverse-transcribed to
cDNA using SuperScriptä III RNase H- and oligo (dT) 12-18
primers (Invitrogen) in a 40
μ
l reaction. Real-time PCR analyses
are performed using a PCR system (Applied Biosystems; Foster
City, CA) in combination with TaqMan
®
chemistry. Glyceraldehyde-
3-phosphate dehydrogenase (GAPDH) can be used as an endog-
enous control to normalize for differences in the amount of cDNA
added to reactions. Specifi c primers and dual-labeled internal fl uo-
rogenic (FAM/TAMRA) probe sets (TaqMan
®
Gene Expression
Assays) for genes of interest are used according to the manufacturer's
recommendation (Applied Biosystems). All PCR amplifi cations
(40 cycles) are performed in a total volume of 50
μ
μ
l, containing 1
μ
l
cDNA, 2.5
μ
l of the specifi c assay on Demand
®
primer/probe mix,
and 25
l of TaqMan
®
Universal master mix (Applied Biosystems).
Relative quantifi cation of gene expression is performed using the
comparative threshold (CT) method as described by manufacturer
(User Bulletin 2; Applied Biosystems). Changes in mRNA expres-
sion level were calculated following normalization to GAPDH and
expressed as fold change over corresponding controls.
μ
Search WWH ::

Custom Search