Biology Reference
In-Depth Information
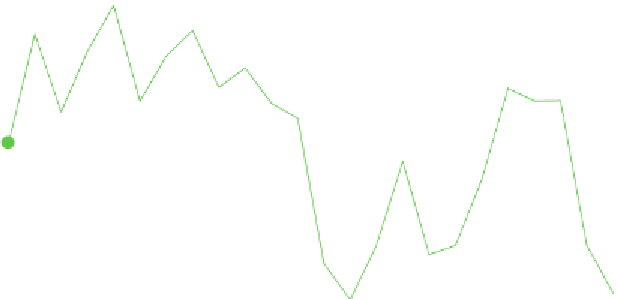
automated data analysis software-CageScore™ has a Sleep Score
algorithm that can automatically quantify wake and sleep in 10 s
segments mainly based on the fl oor-sensor generated waveforms.
Figure
4a
shows the screenshot of raw traces of EEG, EMG, and
SmartCage™ (fl oor-sensor) recordings. Time (minutes in 1 h per
bin) spent in sleep recorded from seven mice was plotted over a
24-h period (Fig.
5b
). Zeitgeber time (ZT) = 0 is light on at 0700
a
EEG
EMG
Smart-
Cage
10 s
b
60
Sleep
50
Auto Score
Manual Score
(SmartCage)
(EEG/EMG)
40
30
20
10
0
1
3
5
7
9
11
13
15
17
19
21
23
Zeitgeber Time
(h)
Fig. 5. Simultaneous SmartCage and EEG/EMG recordings from the same mice for validation of indirect sleep detection.
(
a
) Raw traces of EEG, EMG, and fl oor-sensor outputs were displayed. The SmartCage signals were automatically classifi ed
using the CageScore™ software (AfaSci), while the EEG/EMG signals were manually scored at 10 s epoch. The red trace
indicates wake while blue sleep. (
b
) Pooled data obtained from seven mice (black recordings). The
y
-axis shows the per-
centage of time (in 1-h bins) spent in total sleep detected by EEG/EMG or fl oor-sensor with SmartCage. The
x
-axis shows
the time of day where Zeitgeber time (ZT) 0 = lights on (at 0700 hours) and ZT12 = lights off (1900 hours).


Search WWH ::

Custom Search