Biology Reference
In-Depth Information
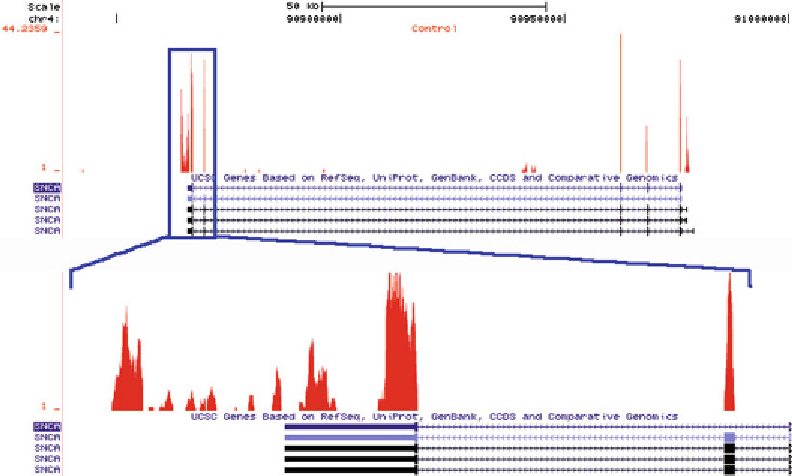
Fig. 2. Distribution of RNAseq tags from an RNAseq experiment on human entorhinal cortex, after alignment with Bowtie
across the Synuclein gene (
SNCA
). The
upper panel
shows peaks of sequence tags across all of the exons of
SNCA
with some
evidence of transcriptional activity originating from intron 4.
Boxed area
shows zoomed view of the 3
¢
UTR of
SNCA
where the
considerable density of observed sequence tags likely indicates an alternate 3
¢
termination site than from that annotated.
manufacturers. Examples are numerous (ELAND (
43
), SOAP
(
44
), MAQ (
45
)); however, a free leading short read aligner
tool set, Bowtie (
46
) and Tophat (
47
), provides a rapid “desktop”
computing approach for aligning high-throughput sequence
data to mammalian genomes, which due to their size, presents
challenges beyond those of other experimental systems. From
this analysis, we can observe the several advantages of RNAseq
over other profi ling technologies, such as microarrays and
Northern blotting, namely new exon discovery, splice variation
and alternate 5¢ and 3¢ transcription start and stop sites (Fig.
2
).
Apart from transcript discovery and identifi cation, the pri-
mary goal of RNAseq experiments is to quantitate the number
of sequences found across samples. As in the early years of
microarray development, there is no clear consensus on the
optimal method for normalizing RNAseq data for comparison
across samples. For a review of the current statistical tools
being utilized, see Bullard et al. (
48
). It is likely that variations
of scaling the data, such as calculating the reads per kilobase
of exon model per million mapped reads (RPKM) will prove
to be the most robust. Tools for quantitative analysis are
less abundant than those for alignment, but commercially
available suites, such as CLC Genomcis work bench (CLC Bio,
Denmark) and Lasergene (DNASTAR, UK), are accessible
options for non-bioinformaticians.
Search WWH ::

Custom Search