Information Technology Reference
In-Depth Information
30
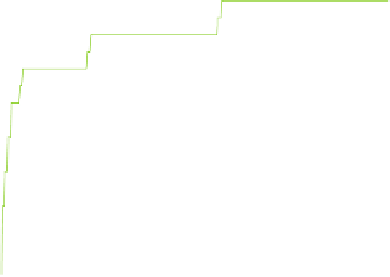
ACTIVE_LIST
ARRAY
ARRAYED_LIST
ARRAYED_SET
ARRAYED_STACK
BINARY_SEARCH_TREE
BINARY_SEARCH_TREE_SET
BINARY_TREE
FIXED_LIST
HASH_TABLE
HEAP_PRIORITY_QUEUE
LINKED_CIRCULAR
LINKED_LIST
PART_SORTED_TWO_WAY_LIST
25
20
15
10
5
0
0
30
60
90
120
150
180
210
240
270
300
330
360
Time (minutes)
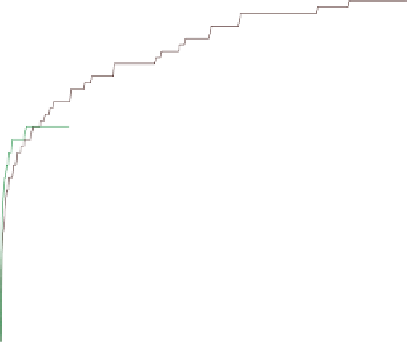
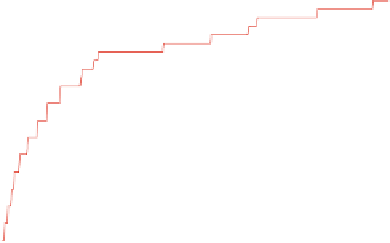
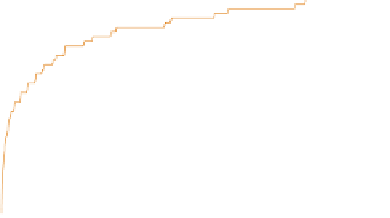
Fig. 4.
Medians of the number of faults detected in each class over time
1.1
ACTIVE_LIST
ARRAY
ARRAYED_LIST
ARRAYED_SET
ARRAYED_STACK
BINARY_SEARCH_TREE
BINARY_SEARCH_TREE_SET
BINARY_TREE
FIXED_LIST
HASH_TABLE
HEAP_PRIORITY_QUEUE
LINKED_CIRCULAR
LINKED_LIST
PART_SORTED_TWO_WAY_LIST
Median of medians
1
0.9
0.8
0.7
0.6
0.5
0.4
0.3
0.2
0.1
0
0
30
60
90
120
150
180
210
240
270
300
330
360
Time (minutes)
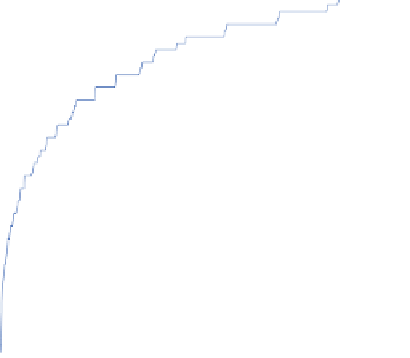
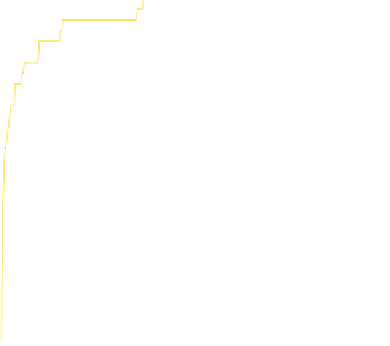
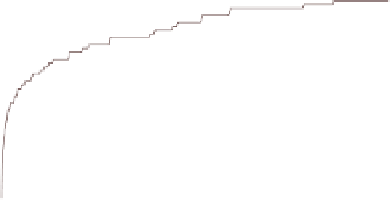
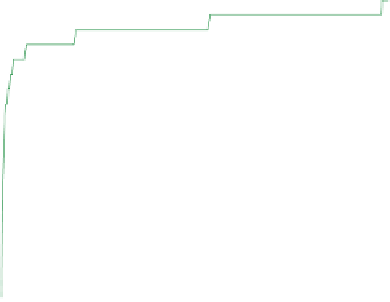
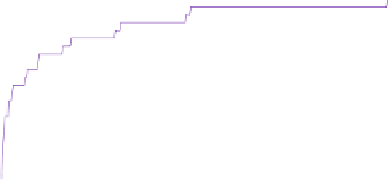
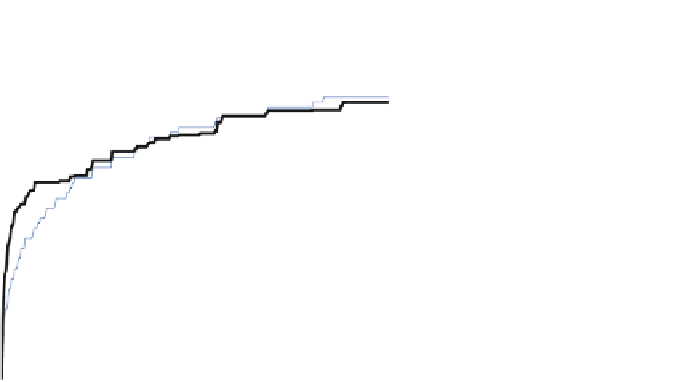
Fig. 5.
Medians of the normalized number of faults detected for each class over time; their median
test run represents the percentage of faults found in that test run against all faults that
we know in the class. The medians of the number of the normalized faults detected over
time for each class are shown in Figure 5. The thick curve is the median of the medians
of the number of normalized faults detected over time for all classes.


Search WWH ::

Custom Search