Information Technology Reference
In-Depth Information
0.5
ACTIVE_LIST
ARRAY
ARRAYED_LIST
ARRAYED_SET
ARRAYED_STACK
BINARY_SEARCH_TREE
BINARY_SEARCH_TREE_SET
BINARY_TREE
FIXED_LIST
HASH_TABLE
HEAP_PRIORITY_QUEUE
LINKED_CIRCULAR
LINKED_LIST
PART_SORTED_TWO_WAY_LIST
Median of stdev
0.4
0.3
0.2
0.1
0
−0.1
30
60
90
120
150
180
210
240
270
300
330
360
Time (minutes)
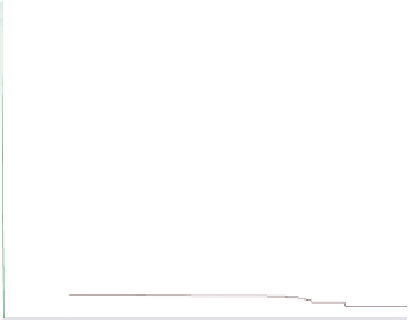
Fig. 3.
Standard deviation of the branch coverage similarity for each class over time; their median
same class), the small standard deviation means that this phenomenon was constantly
observed through all the runs.
The consequence drawn from Figure 2 and Figure 3 is that if a branch is not exercised
by a test run, it is unlikely that it will be exercised by other runs for the same class.
In other words, applying random testing with different seeds to the same class does
not improve branch coverage for that class. Branches not exercised in one run are not
visited in subsequent runs.
3.3
Predictability of Number of Faults
The question of predictability of the number of faults found by random testing was
already addressed in a previous study [5]. The new results confirm that study and extend
it to longer testing sessions (6-hour sessions rather than 90-minute ones), they are also
using the most recent version of AutoTest which benefits from significant performance
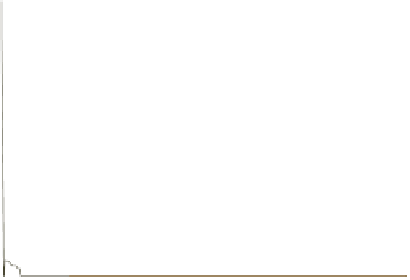
improvements. The median of the number of faults detected for each class over time is
plotted in Figure 4. Note that all the faults found are real faults in a widely used Eiffel
library. This also shows that our testing tool is effective at finding faults. Figure 4 shows
that
54%
of the faults are detected in the first
10
minutes,
70%
in
30
minutes, and
78%
in
1
hour. About
22%
of the faults are detected after
1
hour. This means that after
30
minutes of testing,
70%
of the faults have been detected even though only
4%
additional
branches have been exercised.
Different classes contain different numbers of faults. To compare fault detection
across different classes, we use the normalized number of faults, obtained by divid-
ing the number of faults detected by each test run by the total number of faults found
in all test runs for that particular class. The number of normalized faults for a particular


Search WWH ::

Custom Search