Global Positioning System Reference
In-Depth Information
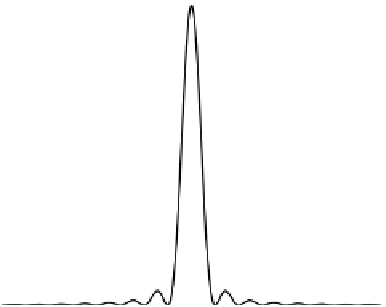
S
X
(ω)
T
ω
FIGURE 1.6. Power spectral density
S
X
(ω)
of a random sequence of pulses.
where
x
is the sampled signal that con-
sists of a sequence of impulses separated in time by
T
s
.Theterm
(
t
)
is the signal being sampled, and
x
δ
(
t
)
δ(
t
−
nT
s
)
represents a delta function positioned at time
t
=
nT
s
. The Fourier transform of
x
δ
(
t
)
is
∞
X
δ
(
f
)
=
f
s
X
(
f
−
nf
s
).
n
=−∞
Figures 1.7 and 1.8 show the sampling process in the time and frequency domain,
respectively.
Figure 1.8 reveals that if the sampling rate
f
s
is lower that 2
B
, then the fre-
quency-shifted components of
X
overlap and the spectrum of the sampled
signal is not similar to the spectrum of the original signal
x
(
f
)
(
t
)
. The spectral over-
lap effect is known as
aliasing
, and the sampling rate
f
s
=
2
B
is called the
Nyquist rate
.
To avoid the effects of aliasing, we may use a lowpass anti-aliasing filter to
attenuate frequency components above
B
, (see Figure 1.8), and sample the signal
with a rate higher than the Nyquist rate, i.e.,
f
s
>
2
B
. We return to the issue of
sampling in Chapter 4.
1.3
Characterization of Systems
In the continuous-time domain, a system is a functional relationship between the
input signal
x
(
)
(
)
t
and the output signal
y
t
. The input-output relation of a system
may be denoted as
y
f
x
)
,
(
t
0
)
=
(
t
where
−∞
<
t
,
t
0
<
∞
.
(1.17)


Search WWH ::

Custom Search