HTML and CSS Reference
In-Depth Information
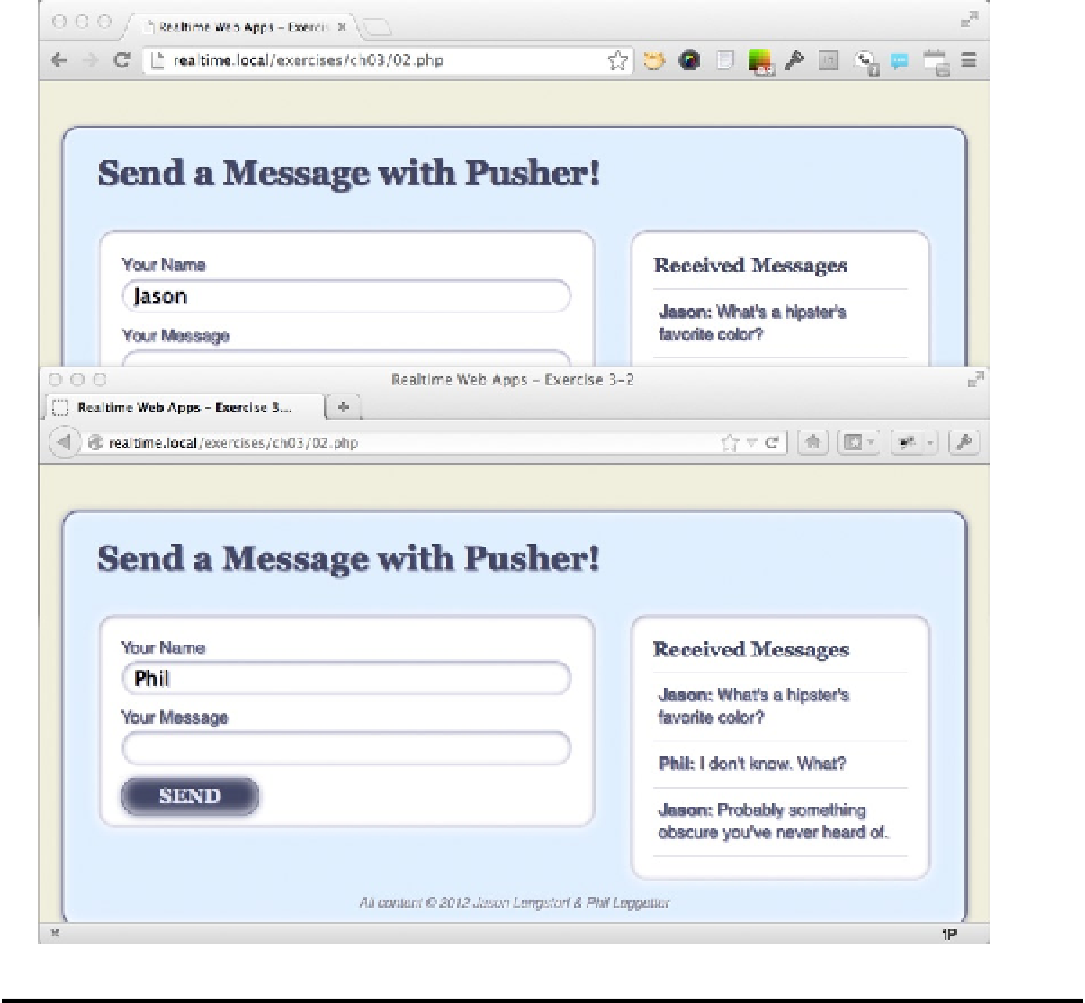
Figure 3-7.
Messages posted in one browser display in the other in realtime
Debugging Your Pusher Application
As a developer, you'll know that things don't always go according to plan. When this happens, you need to start
debugging your application to try and work out why what you are expecting to happen, isn't!
If you find yourself in this situation, developer tools are your best friends. And luckily all the major browser
vendors now provide you with a good set of tools that give you access to a JavaScript console, execute code on the fly,
debug running code, inspect elements within a web page, and much more. Hosted services are also exposing good
developer tools that let you see what's going on within the service and perform some manual testing. We've seen this
earlier with the Pusher Debug Console and Event Creator.
Search WWH ::

Custom Search