Information Technology Reference
In-Depth Information
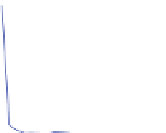
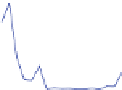
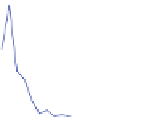
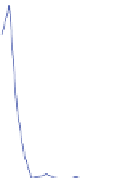
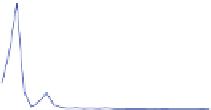
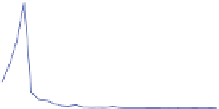
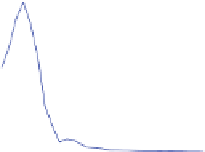
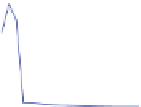
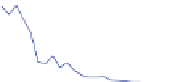
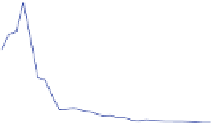
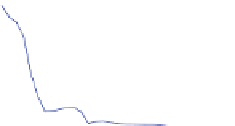
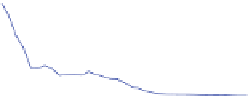
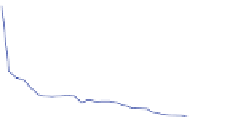
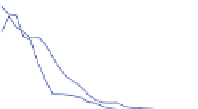
KL distance between distributions at
consecutive time points
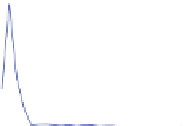
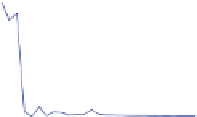
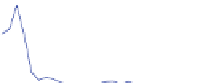
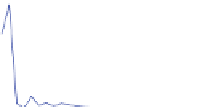
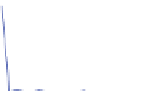
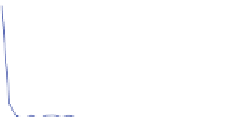
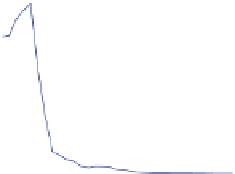
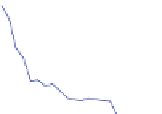
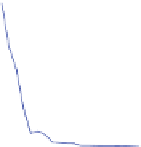
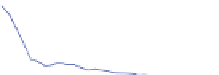
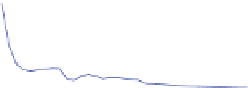
KL distance w.r.t. the final distribution
0.8
0.8
0.7
0.7
0.6
0.6
0.5
0.5
0.4
0.4
0.3
0.3
0.2
0.2
0.1
0.1
0
0
0
5
10
15
20
25
30
35
40
0
5
10
15
20
25
30
35
40
Time points
Time points
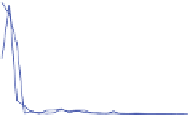
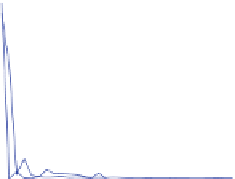
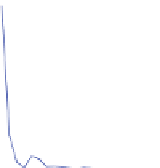
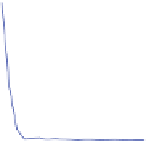
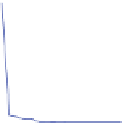
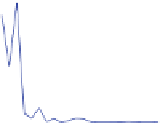
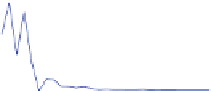
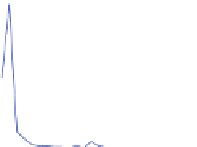
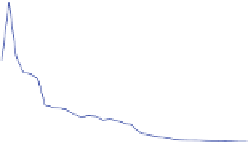
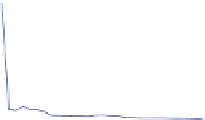
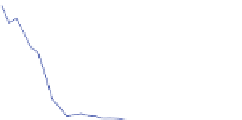
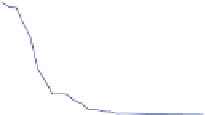
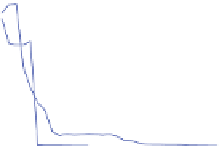
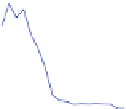
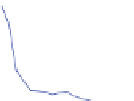
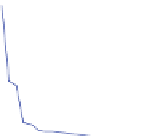
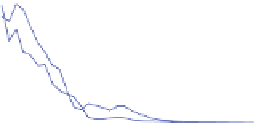
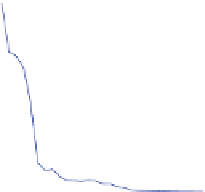
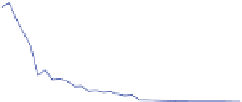
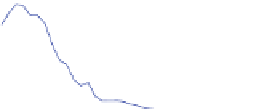
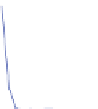
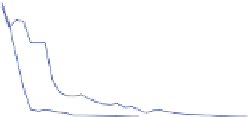
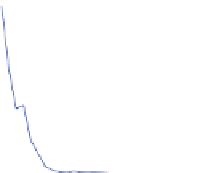
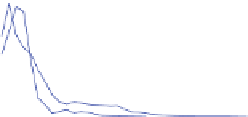
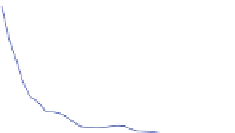
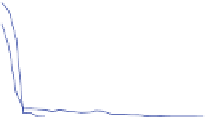
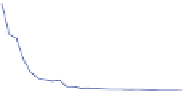
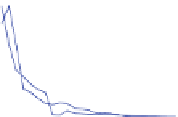
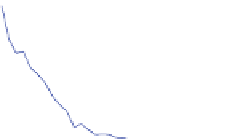
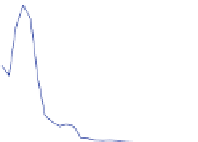
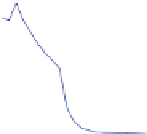
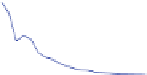
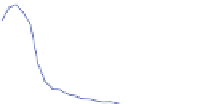
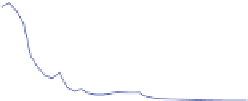
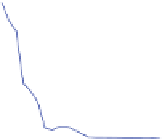
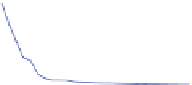
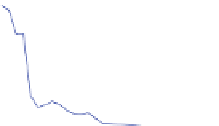
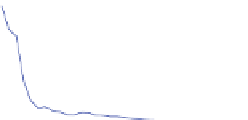
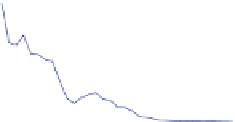
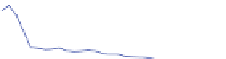
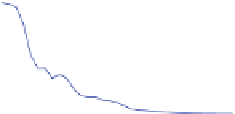
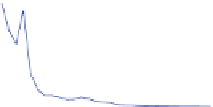
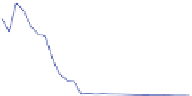
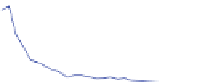
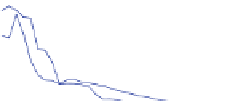
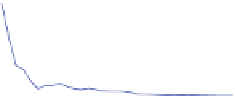
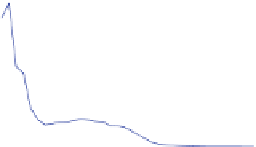
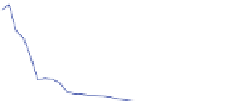
Fig. 5.4
(
left
). Kullback-Leibler divergence between tag frequency distributions at consecutive
time steps for 500 “Popular” sites. (
right
). Kullback-Leibler divergence of tag frequency distribu-
tion at each time step with respect to the final distribution
The two methods are complementary; the first methodology would converge
to zero if the two consecutive distributions are the same, and thus one could
detect whether distributions converged if even temporarily. Cyclical patterns of
stabilization and destabilization may be detected using this first method. The
second method assumes that the final time point is the stable distribution so this
method detects convergence only towards the final distribution. If both of these
methods produce relative entropies that approach zero, then one can claim that the
distributions have converged over time to a single distribution, the distribution at the
final time point. Given our interest in distributions that have converged to power-
laws, we are actually examining the dynamics of convergence to a power-law.
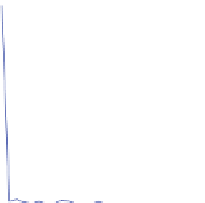
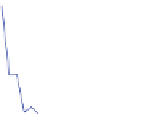
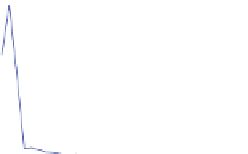
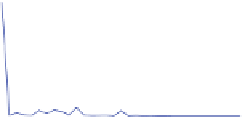
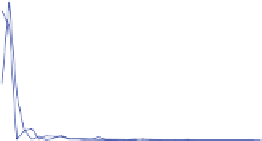
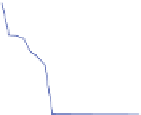
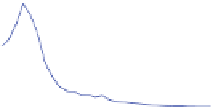
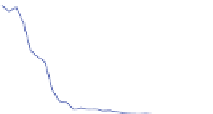
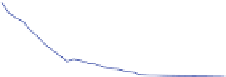
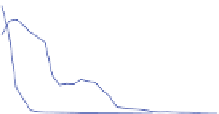
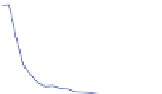
5.2.4.3
Empirical Results for Tag Dynamics
The analysis of the intermediate dynamics of tagging is considerably more involved
than the analysis of final tag distributions. Because the length of the histories varies
widely, there is no meaningful way to compute a cumulative measure across all
sites as in Sect.
5.2
, so our analysis has to consider each resource individually. In
Fig.
5.4
a, b, we plot the results for the convergence of the 500 “Popular” sites, on
the basis that their final distribution must have converged to a power law, that their
complete tagging history was available from the first tagging instances, and that this
history was of substantial length. In the data set considered, up to 35 time points are
available for some sites (which roughly corresponds to 3 years of data, since one
time point represents 1 month).


Search WWH ::

Custom Search