Information Technology Reference
In-Depth Information
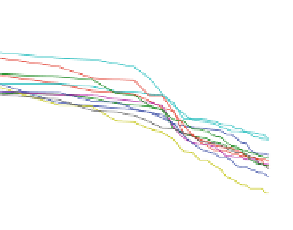
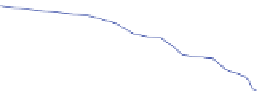
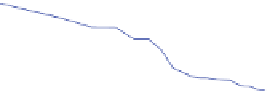
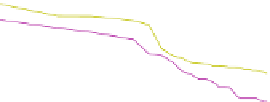
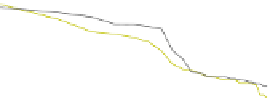
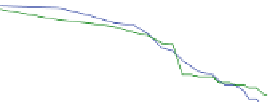
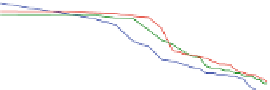
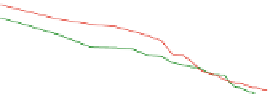
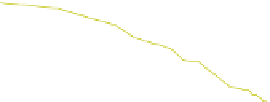
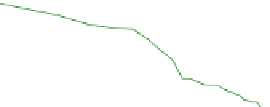
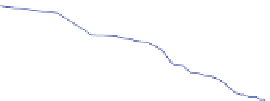
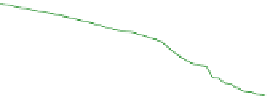
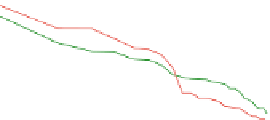
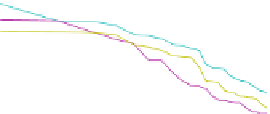
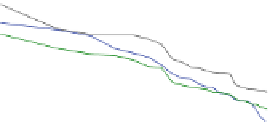
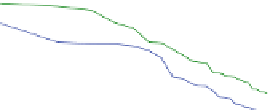
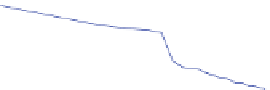
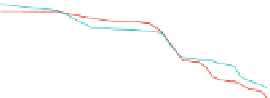
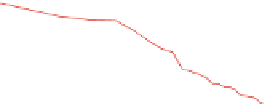
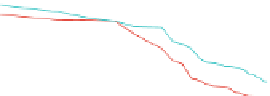
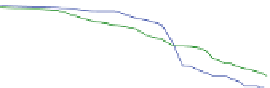
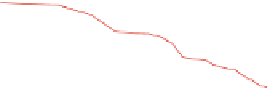
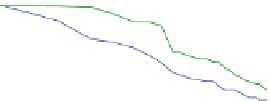
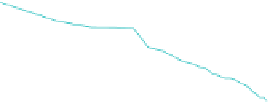
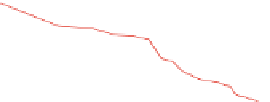
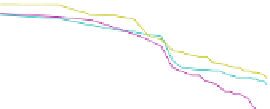
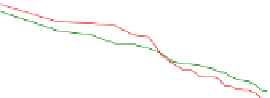
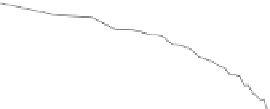
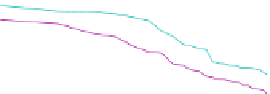
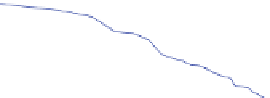
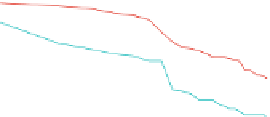
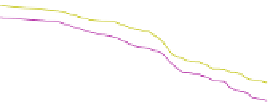
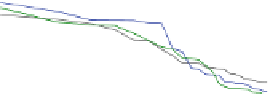
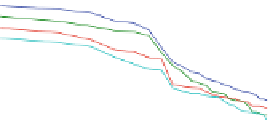
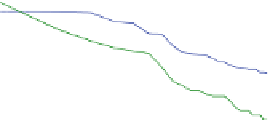
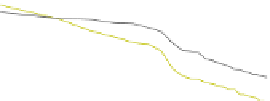
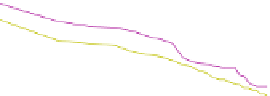
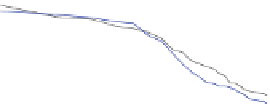
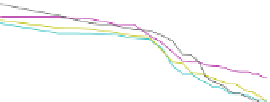
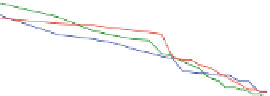
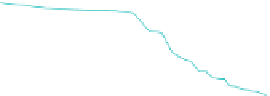
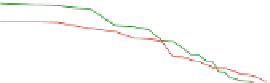
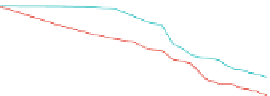
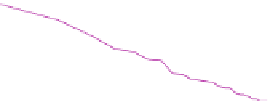
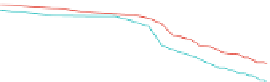
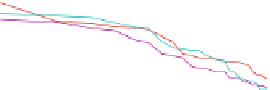
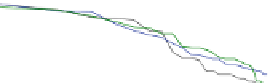
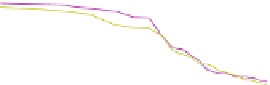
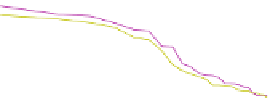
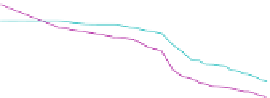
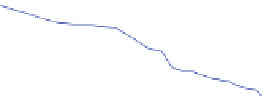
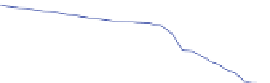
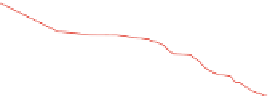
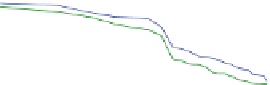
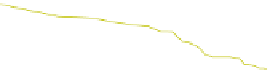
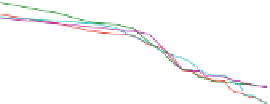
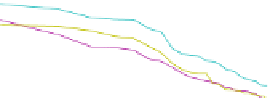
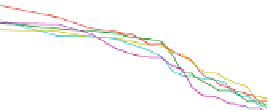
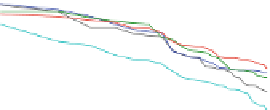
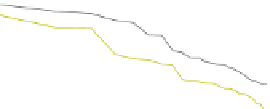
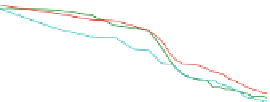
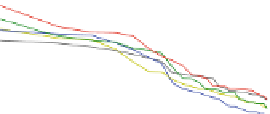
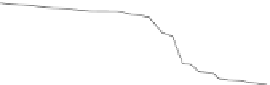
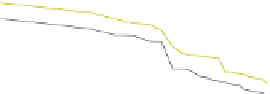
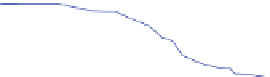
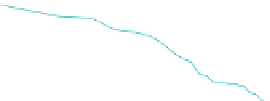
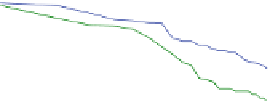
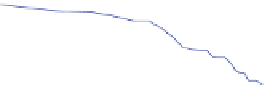
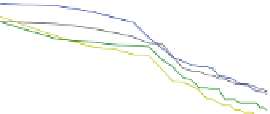
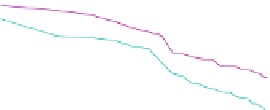
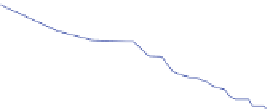
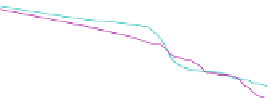
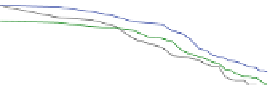
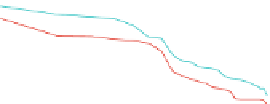
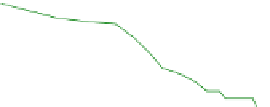
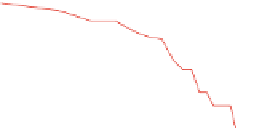
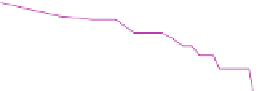
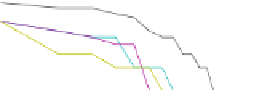
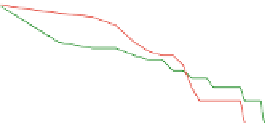
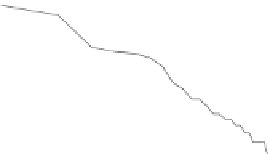
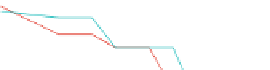
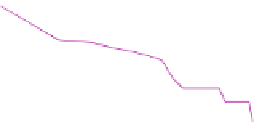
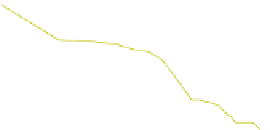
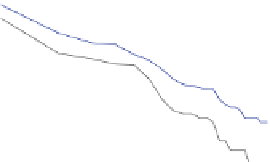
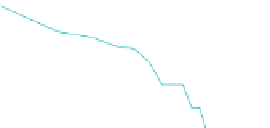
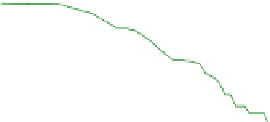
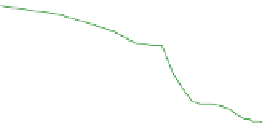
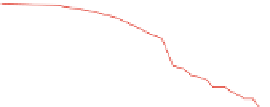
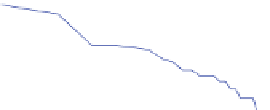
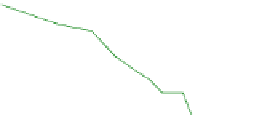
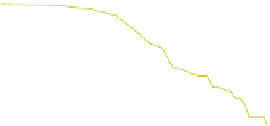
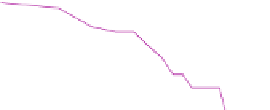
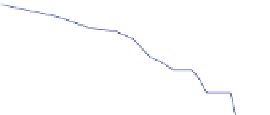
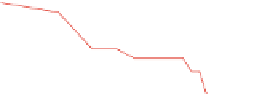
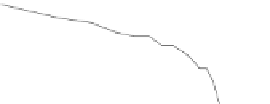
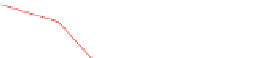
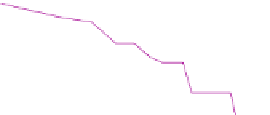
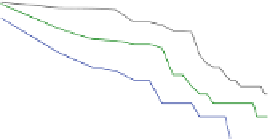
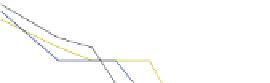
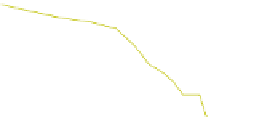
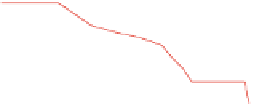
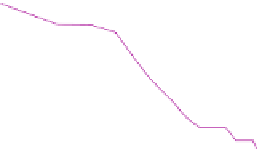
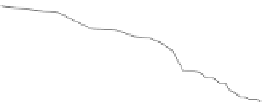
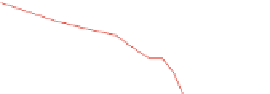
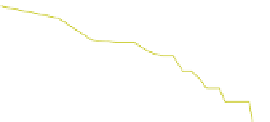
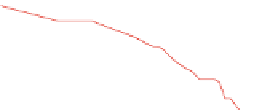
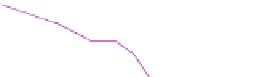
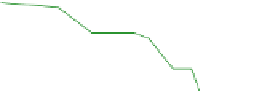
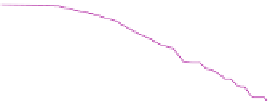
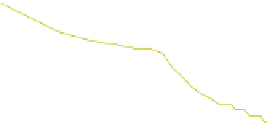
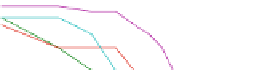
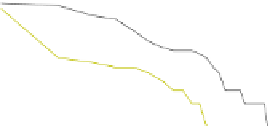
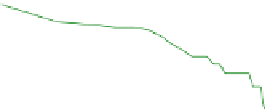
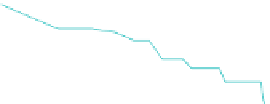
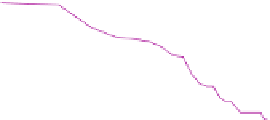
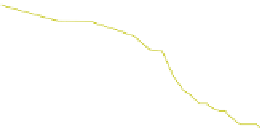
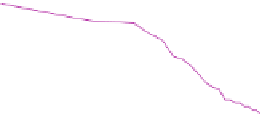
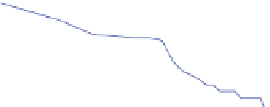
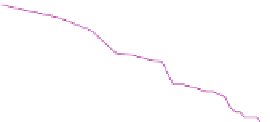
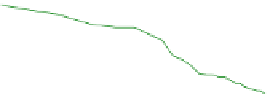
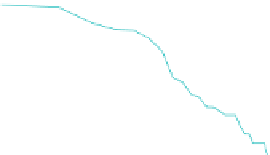
Individual tag distributions for 500 popular sites
(log−log scale)
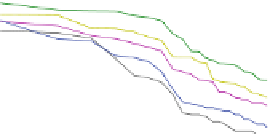
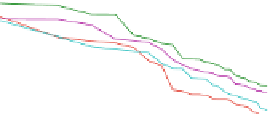
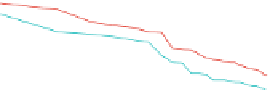
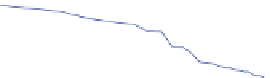
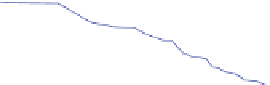
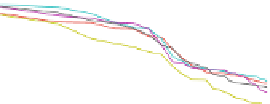
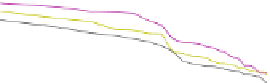
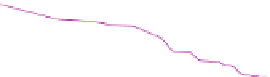
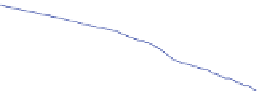
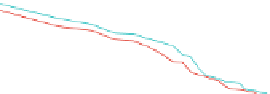
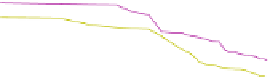
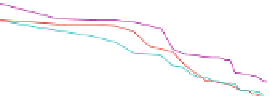
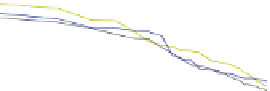
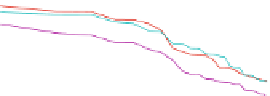
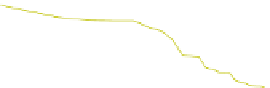
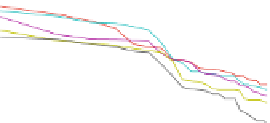
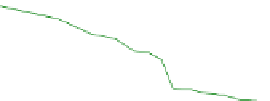
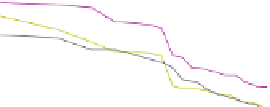
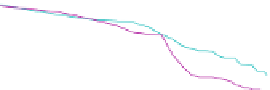
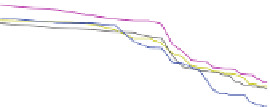
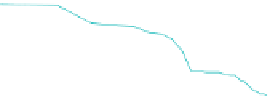
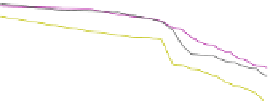
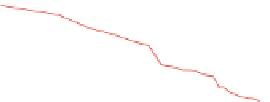
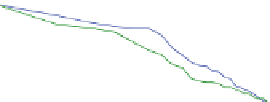
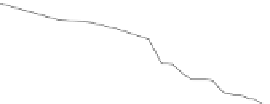
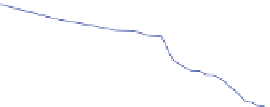
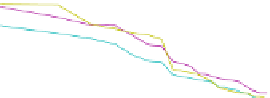
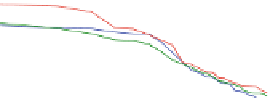
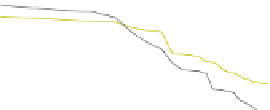
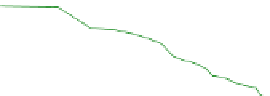
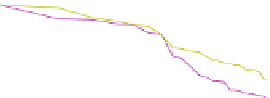
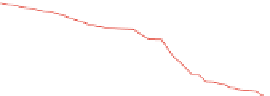
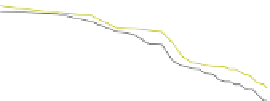
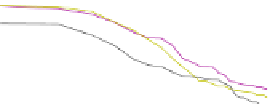
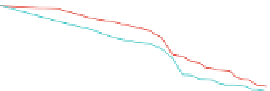
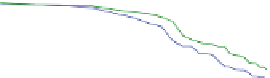
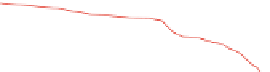
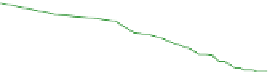
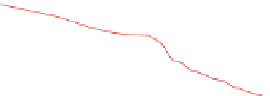
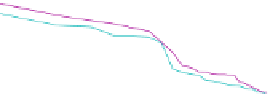
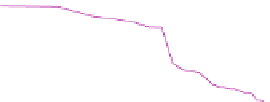
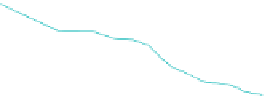
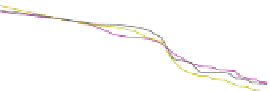
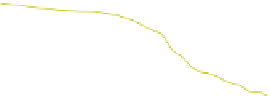
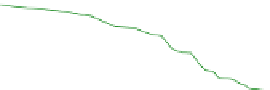
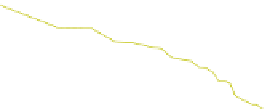
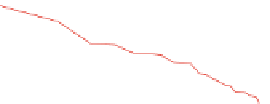
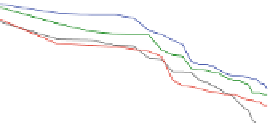
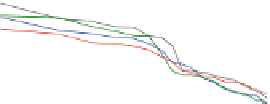
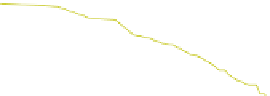
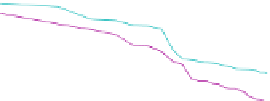
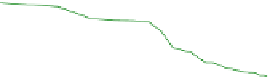
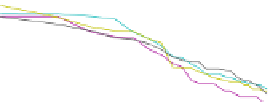
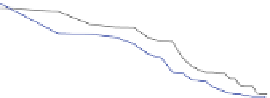
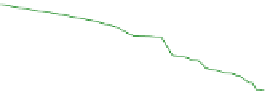
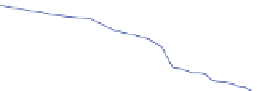
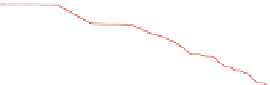
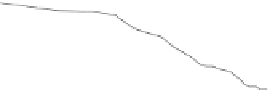
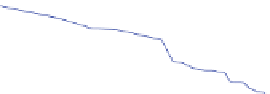
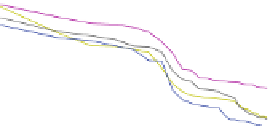
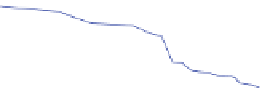
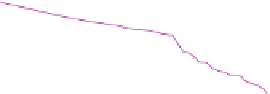
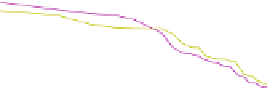
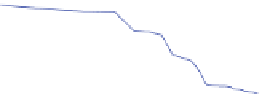
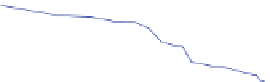
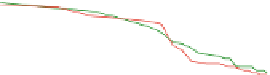
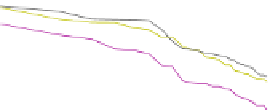
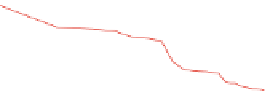
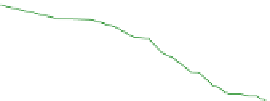
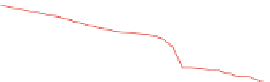
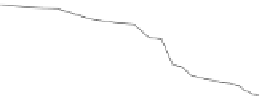
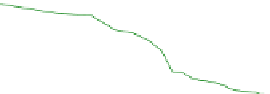
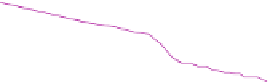
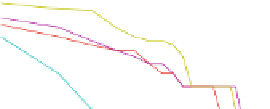
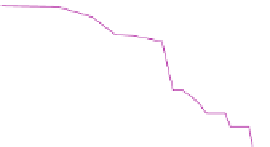
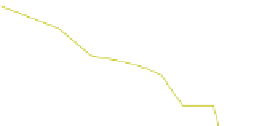
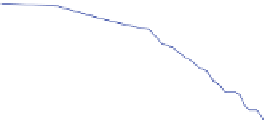
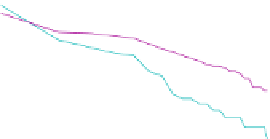
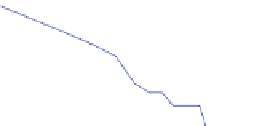
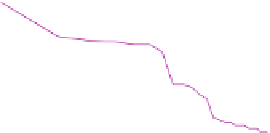
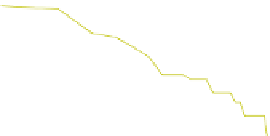
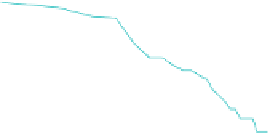
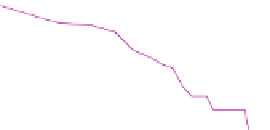
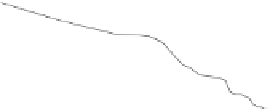
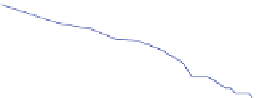
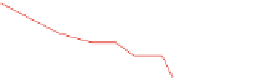
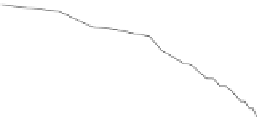
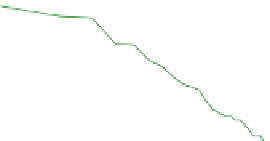
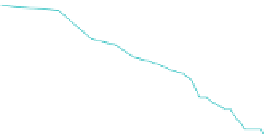
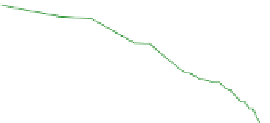
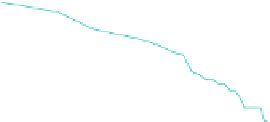
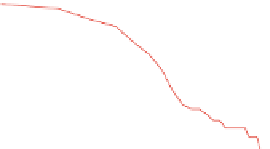
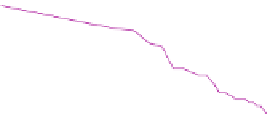
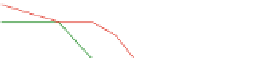
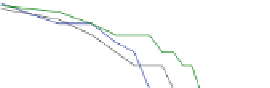
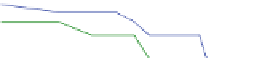
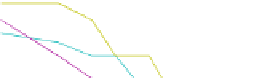
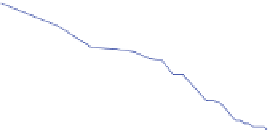
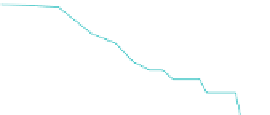
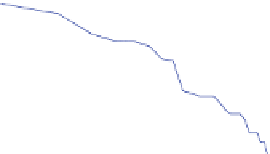
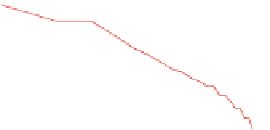
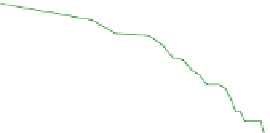
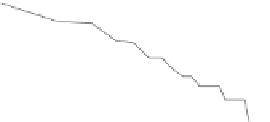
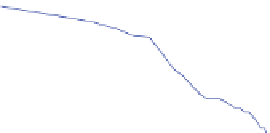
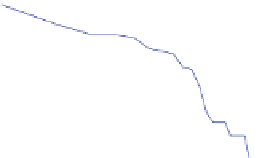
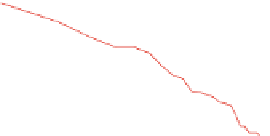
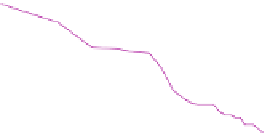
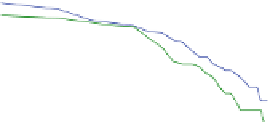
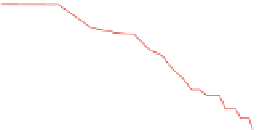
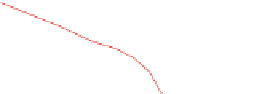
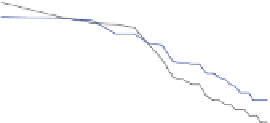
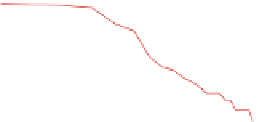
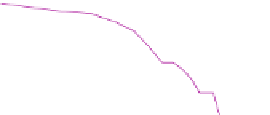
Individual tag distributions for 250 less popular sites
(log−log scale)
14
10
9
12
8
10
7
6
8
5
6
4
3
4
2
2
1
0
0
0
0.5
1
1.5
2
2.5
3
3.5
4
4.5
5
0
0.5
1
1.5
2
2.5
3
3.5
4
4.5
5
Relative position of a tag
(log
2
scale)
Relative position of a tag
(log
2
scale)
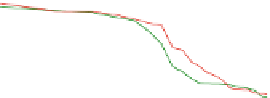
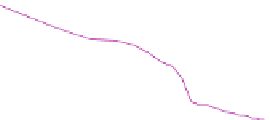
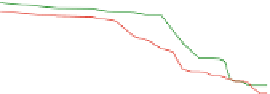
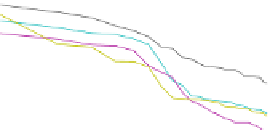
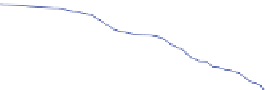
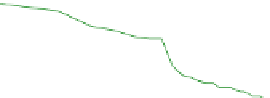
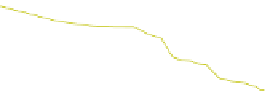
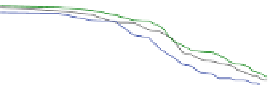
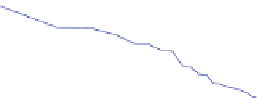
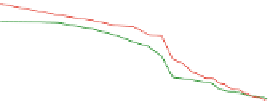
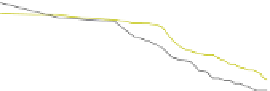
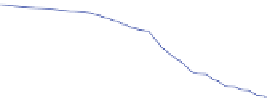
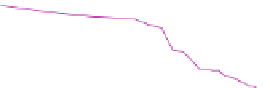
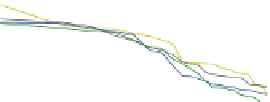
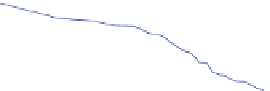
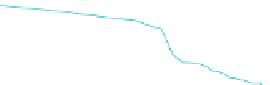
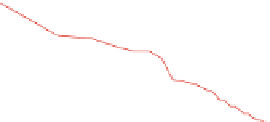
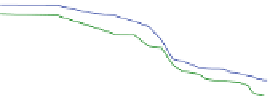
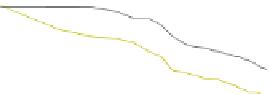
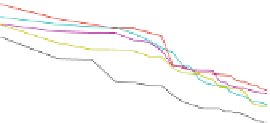
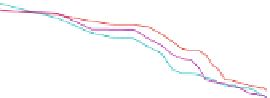
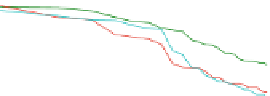
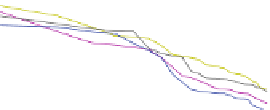
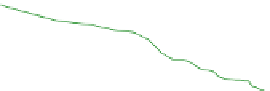
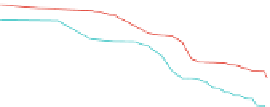
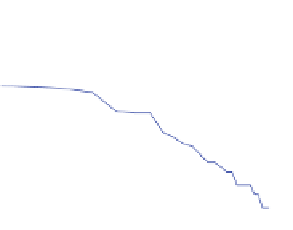
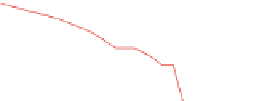
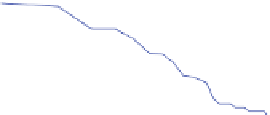
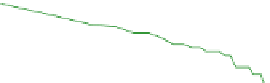
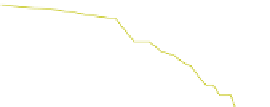
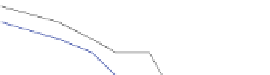
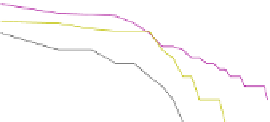
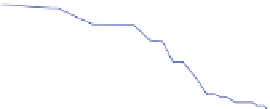
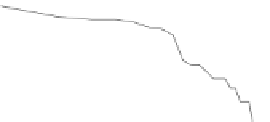
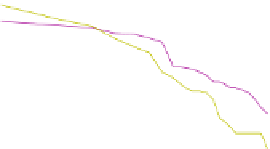
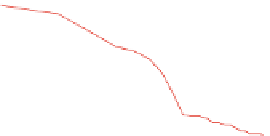
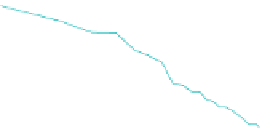
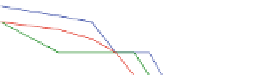
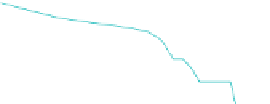
Fig. 5.2
Frequency of tag usage relative to tag position. For each site, the 25 most frequently used
tags were considered. The plot uses a double logarithmic (log-log) scale. The data is shown for
a set of 500 randomly-selected, heavily tagged sites (
left
) and for a set of 500 randomly-selected,
less-heavily tagged sites (
right
)
the del.icio.us site, though “Recent” sites are those tagged within the short time
period immediately prior to viewing by the user and “Popular” sites are those
which are heavily tagged in general.
3
While the exact algorithms used by del.icio.us
to determine these categories are unknown, they are currently the best available
approximations for random sampling of del.icio.us, both of heavily tagged sites and
of a wider set of sites that may not be heavily tagged.
The mean number of users who tagged resources in the “Popular” data set was
2074.8 with a standard deviation of 92.9, while the mean number of users of the
“Recent” data set was 286.1 with a standard deviation of 18.2. In all cases, the tags
in the top 25 positions in the distributions have been considered and thus all of our
claims refer to these tags. Since the tags are rank-ordered by frequency and the top
25 is the subset of tags that are actually available to del.icio.us users to examine for
each site, we argue that using the top 25 tags is adequate for this examination.
Results are presented in Fig.
5.2
. In all cases, logarithm of base 2 was used in the
log-log transformation.
4
As shown by Newman and Girvan (2004) and others, the main characteristic of
a power law is its slope parameter
. On a log-log scale, the constant parameter
c
only gives the “vertical shift” of the distribution with respect to the y-axis. For each
of the sites in the data set, the corresponding power law function was derived and the
α
3
All data used in the convergence analysis was collected in the week immediately prior to 19 Nov
2006.
4
Note that the base of the logarithm does not actually appear in the power law equation (c.f. (
5.1
)),
but because we use empirical and thus possibly noisy data, this choice might introduce errors in
the fitting of the regression phase. However, we did not find significant differences from changing
the base of the logarithm to
e
or 10.


Search WWH ::

Custom Search