Agriculture Reference
In-Depth Information
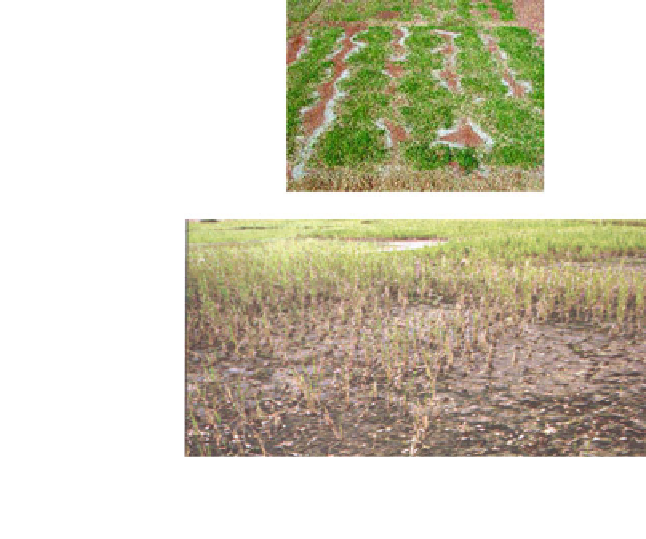
Fig. 8.2
View of salinity
affected crop fields: (
a
)salt
appears at the surface (
top
one
), (
b
)riceplantsare
partially damaged due to
saline water (
bottom one
)
(a)
(b)
Table 8.4
Potential symptoms of salinity, sodicity and high soil pH
Soil problem
Potential symptoms
Saline soil
•
White crust on soil surface
•
Water stressed plants
•
Leaf tip burn
Sodic soil
•
Dark powdery residue on soil surface
•
Poor drainage, crusting or hardsetting
•
Low infiltration rate; high runoff and erosion
•
Stunted plants with leaf margins burned
Saline-sodic soil
•
Generally, same symptoms as in saline soil
High soil pH
•
Stunted yellow plants
•
Dark green to purplish plants
depends upon cropping system and the nature of the situation. However, crop salin-
ity thresholds are based on the average salinity level of the active root zone. If the
site in question is irrigated, water sample should be collected for analysis as well.
High levels of salts and sodium may come from irrigation water, a high water table,
manure or fertilizer inputs, or from the soil parent material. To manage the problem
effectively, you need to know the source of the salts. Although 2.0 dS/m is used as
a threshold EC to define saline soils, many crops may show symptoms and reduced
yields at much lower ECs (1.5-2.0 dS/m).
Other information, including soil texture, cation exchange capacity, type of clays
present, calcium carbonate content, organic matter, depth to groundwater, and soil
profile information, will help in planning a reclamation program.

Search WWH ::

Custom Search