Travel Reference
In-Depth Information
Apart from that, the performance of Malaysian
REIT can be measured in the form risk and vola-
tility as compared to the other market alternative
investment option. Chai, Choong, Koh and Tham
(2011) concludes that Malaysian REITs displayed
better performance as compared to other market
during the financial crisis period and possess lower
degree of overall risk or volatility. Furthermore, the
study conducted by Tan (2009) shows the system-
atic risk of M-REIT is lower than the market port-
folio which indicate that M-REITs are less volatile
as compared to the stock market. Besides that, the
performance of Malaysian REIT can also be seen
through correlation with other REIT available in
the market especially the Asian REIT. According
to Nawawi, Husin, Hadi and Yahya (2010), Malay-
sian REIT lagged for up two months behind Asian
REIT indicating a positive correlation between
M-REITs and Asian REIT. However, there is no
correlation between Malaysian REIT market and
the Asian REITs market for a long period.
Apart from that, in order to understand how
well the M-REIT company performs, an analysis of
the M-REITs financial and management strength
need to be conducted. According to Dynaqueast,
the financial strength is one of the most critical
measures of the worth of an investment besides
stability and growth.
Table 1.
Property portfolio.
Malaysia
JW Marriott Hotel Kuala Lumpur
The Ritz-Carlton Kuala Lumpur
The Pangkor Laut, Tanjong Jara
Cameron Highland resorts
The Vistana chain of hotels in Kuala Lumpur,
Penang and Kuantan
International portfolio
Hilton Niseko, Japan
The Sydney Harbour, Australia
Melbourne Marriot hotels, Australia
3 RESEARCH METHODOLOGY
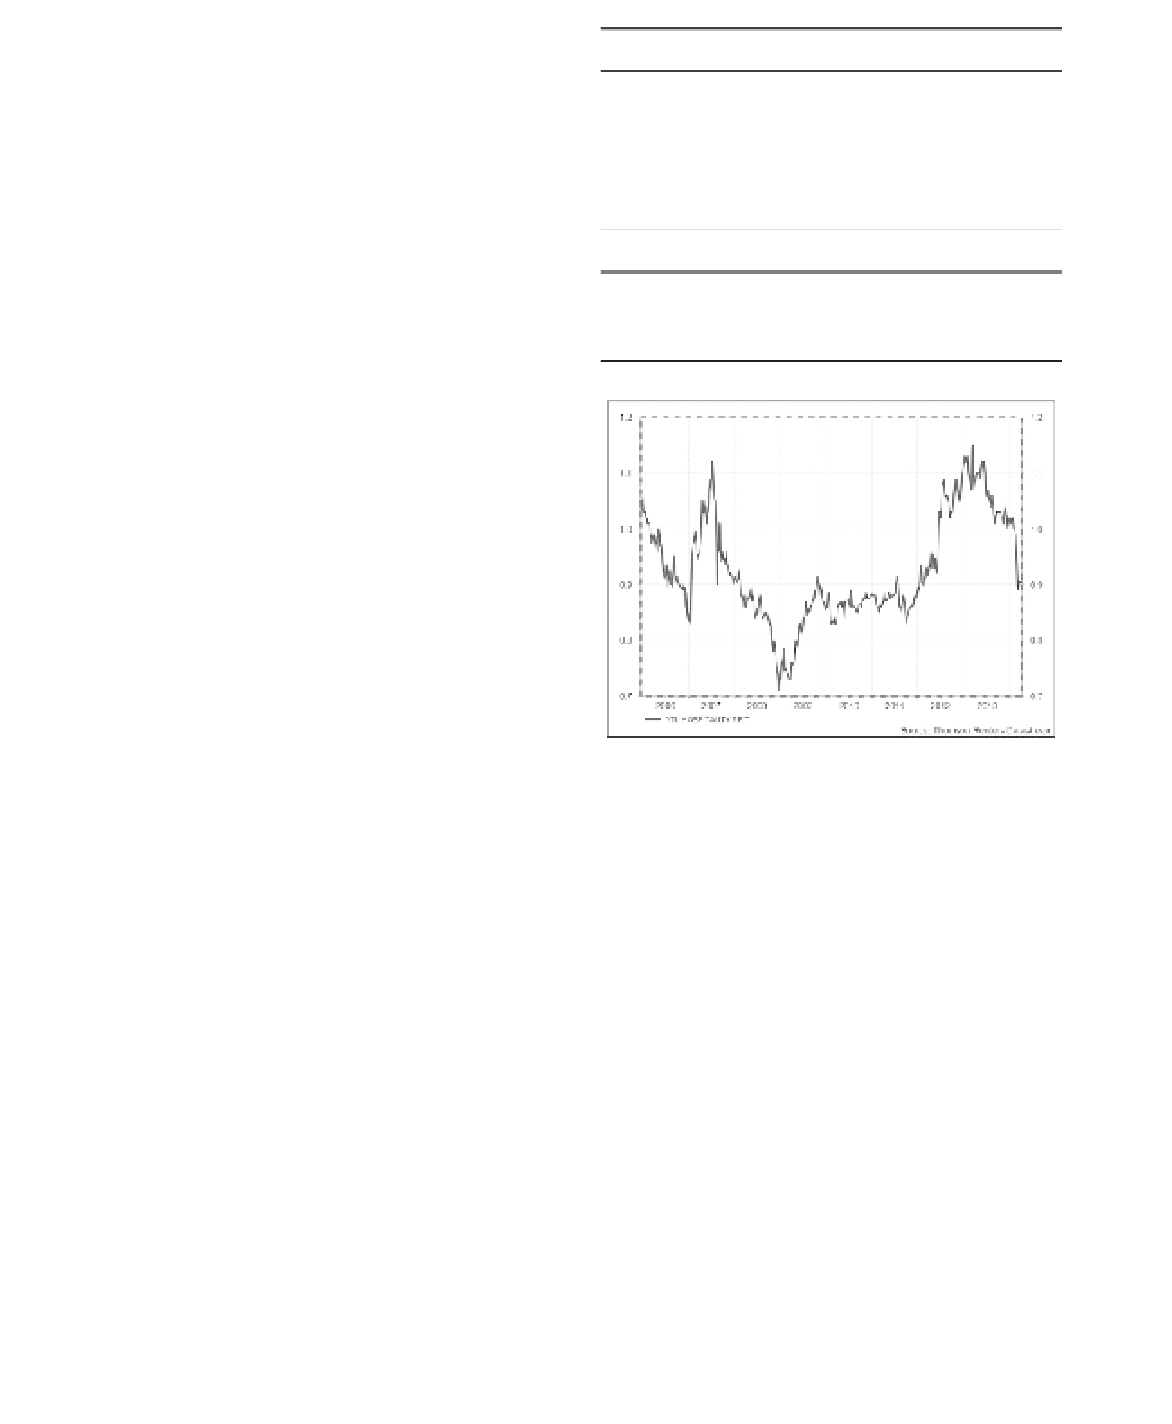
Figure 1.
YTL hospitality REIT's share price.
Content Analysis is being adopted in the research.
The measurement performance of asset perform-
ance usually be seen in the form of financial ratios,
occupany level, rental rate and growth. However,
for the purpose of this study, the performance of
the Hospitality REIT will be deployed in term
of Ratio Analysis which includes the Profitabil-
ity Ratios, Operating Ratio and Leverage Ratios.
Ratio analysis of financial statement from Annual
Report will be used in the research to ascertain the
profit margin since 2010 to 2013.
Table 1 shows the diversified property portfolio
owned by the company in optimizing the return of
the investors.
4.2
Performance analysis
Performance generated from Data Stream is
depicted in Figures 1 to 3. It can be seen that
market confidence was stable and even increased
throughout 2010 and 2013. Share price reached its
peak between 2012 and 2013. In the middle 2012,
the highest peak of share price was mainly due to
two possible reasons: firstly, stable fixed lease rent-
als arising from its existing property portfolio and,
secondly, variable income from the three Marriott
hotels located in prime tourist destinations in Aus-
tralia's major cities will, increasing the potential for
distribution per unit growth.
In tandem with the growing performance for
the year 2012, the company has also declared a
very handsome dividend to its shareholders at the
closing year of 2013 with dividend yield of 8.2.
Earnings per share between 2012 and 2013 were
considerably high at 0.50 and above.
4
A CASE STUDY OF YTL HOSPITALITY
REITS
4.1
Introduction
YTL Hospitality REIT was listed on 16 December
2005 on the Main Market of Bursa Malaysia Secu-
rities Berhad under the name Starhill Real Estate
Investment Trust (YTL Hospitality REIT, 2014).
YTL Hospitality REIT has a market capitalization
of approximately RM1,212 million (as at 30 April
2014) which major investment portfolio focusing
on prime hotel and hospitality-related properties.


Search WWH ::

Custom Search