Travel Reference
In-Depth Information
−
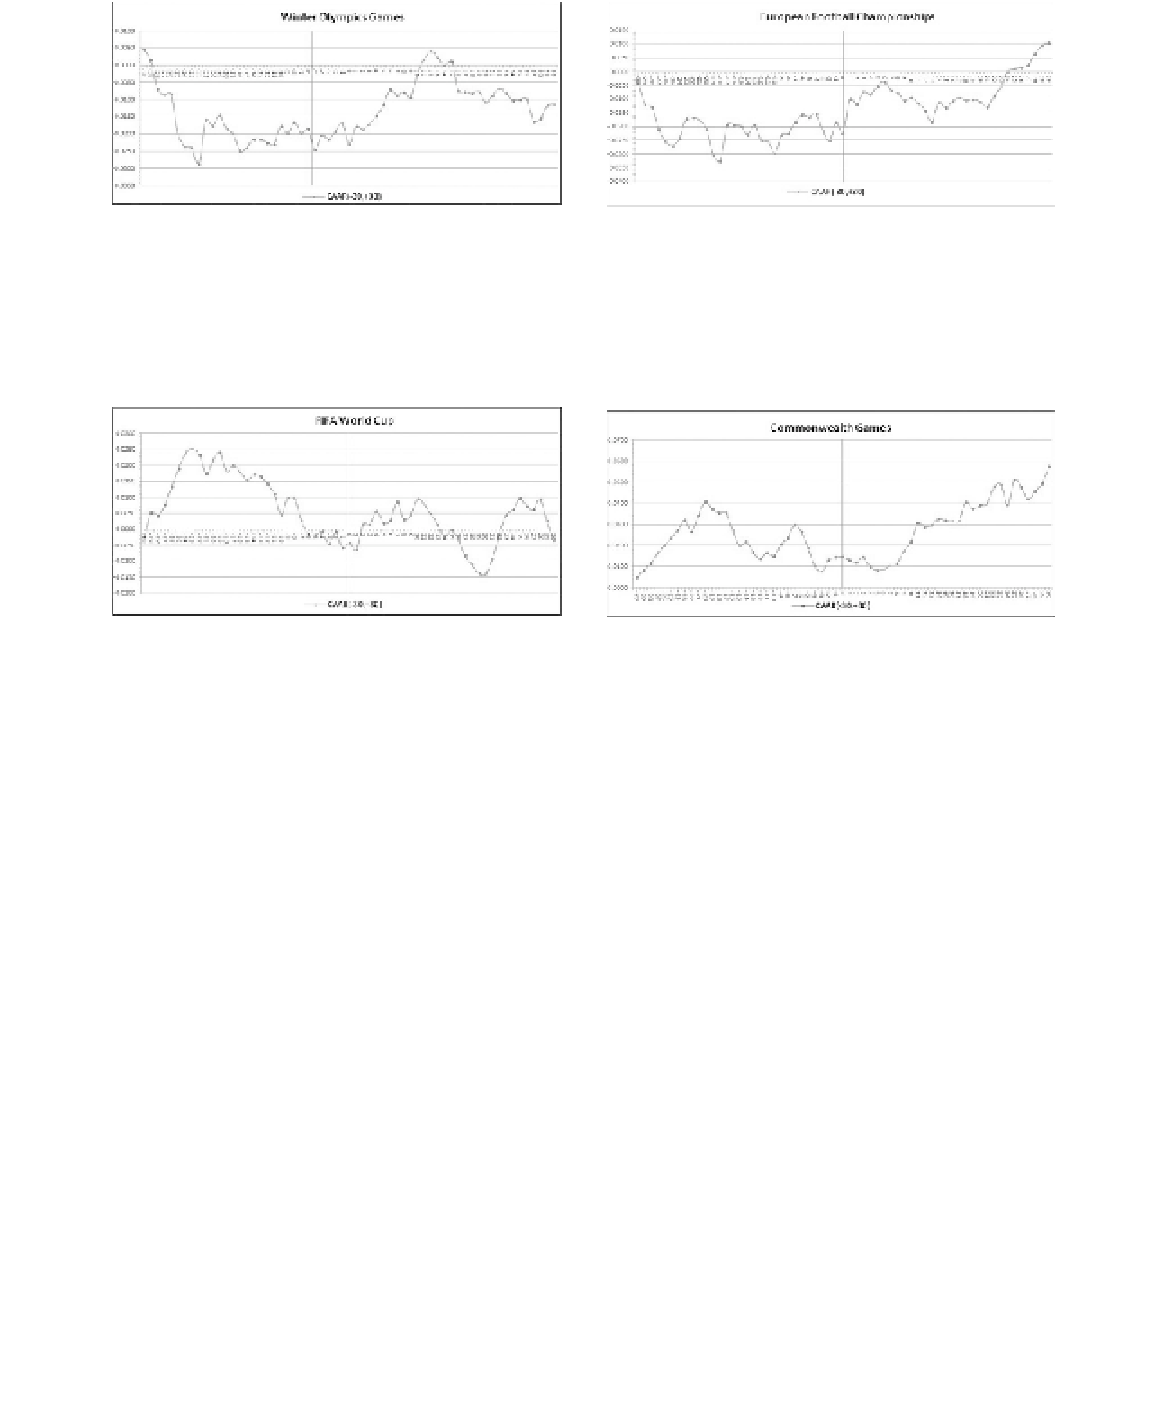
Figure 3. CAAR (
30) across whole stock
market of Winter Olympics Games hosting coun-
tries adjacent to the events announcement date on
each of the days in the 30 days symmetric window.
Note
: The actual data can be provided upon request.
30,
+
Figure 5. CAAR (−30,+30) across whole stock mar-
ket of European Football Championships hosting
countries adjacent to the events announcement date
on each of the days in the 30 days symmetric window.
Note
: The actual data can be provided upon request.
−
30,+30) across whole stock market
of FIFA World Cup hosting countries adjacent to the
events announcement date on each of the days in the 30
days symmetric window.
Note
: The actual data can be provided upon request.
Figure 4.
CAAR (
Figure 6. CAAR (−30,+30) across whole stock mar-
ket of Commonwealth Games adjacent to the events
announcement date on each of the days in the 30 days
symmetric window.
Note
: The actual data can be provided upon request.
date till day 30, it shows an increase of 1.16 percent
in negative zone.
Figure 4 shows the CAAR across whole mar-
ket of FIFA Would Cup hosting countries. Prior
to the event announcement date, the CAAR trend
shows maximum return of 2.51 percent at day 23
and is decreasing till negative zone from day 6 till
event announcement date. However, the CAAR
trend shows increasing trend from negative zone
to positive zone following the event announce-
ment date with increase of 1.37 percent from
by decrease to 0.42 percent at day 13. From the
day of announcement till day 30, it shows positive
return of 3.29 percent.
Figure 6 shows the CAAR across whole market
of Commonwealth Games hosting countries. The
CAAR trend shows minimum return of 0.85 percent
at day 30 and reaches maximum return of 4.06 per-
cent at day 20 but decrease 2.29 percent from 3.74
percent at day 19 till 1.18 percent at event announce-
ment date. However, the CAAR trend shows insignif-
icant and negative increase of 0.32 percent following
the event announcement date till day 8. The CAAR
trend starts to increase on day 9 onward with maxi-
mum return of 4.28 percent from 1.18 percent at the
event date to 5.73 percent at day 30.
In sum, the cross sectional CAAR (
.42
percent at event date to .95 percent at day 6 but
it decreases to
−
−
.97 percent from
−
.42 percent at
event date to
1.39 percent at day 20. From the
date of announcement till day 30, it shows a small
increase at about .06 percent.
Figure 5 shows the CAAR across whole mar-
ket of European Football Championships hosting
countries. The CAAR trend shows negative return
of 1.86 percent from
−
30)
trend analysis for individual game such as Summer
Olympic Games, European Football Champion-
ships and Commonwealth Games with positive
return in positive zone at 2.34 percent, 3.19 percent
and 5.73 percent respectively. However, the CAAR
(
−
30,
+
−
0.40 percent at day 30 to
−
2.26 percent at event announcement date. The
CAAR trend also indicates an increasing trend
following the event announcement date which the
return increased 1.89 percent from
30) trend analysis of Winter Olympic Games
and FIFA World Cup shows insignificant positive
return in negative zone at .06 percent and 1.16 per-
cent after the event announcement date.
−
30,
+
−
2.26 percent at
event date up to
−
0.37 percent at day 6 and follows


Search WWH ::

Custom Search