Travel Reference
In-Depth Information
comprises of Kuala Lumpur, its suburbs and
adjoining cities and towns in the state of Selangor,
such as Shah Alam, Petaling Jaya, and Klang is
the data collection setting. This study employed,
self-administered questionnaire and questions are
designed to measure levels of agreement relevant
to issue investigated with seven points Likert scale.
Surveyed with experienced respondents was
undertaken at seven selected popular restaurants
among the Malay, Chinese and Indian in Kuala
Lumpur, Shah Alam, Petaling Jaya and Kelang in
five weekends. Respondents randomly approached
after finishing dined with a screening question
whether they had experienced in preparing and
consuming all three major ethnic foods. Those
answered “yes” were preceded with the question-
naire. With a positive response, 392 questionnaires
were successfully collected.
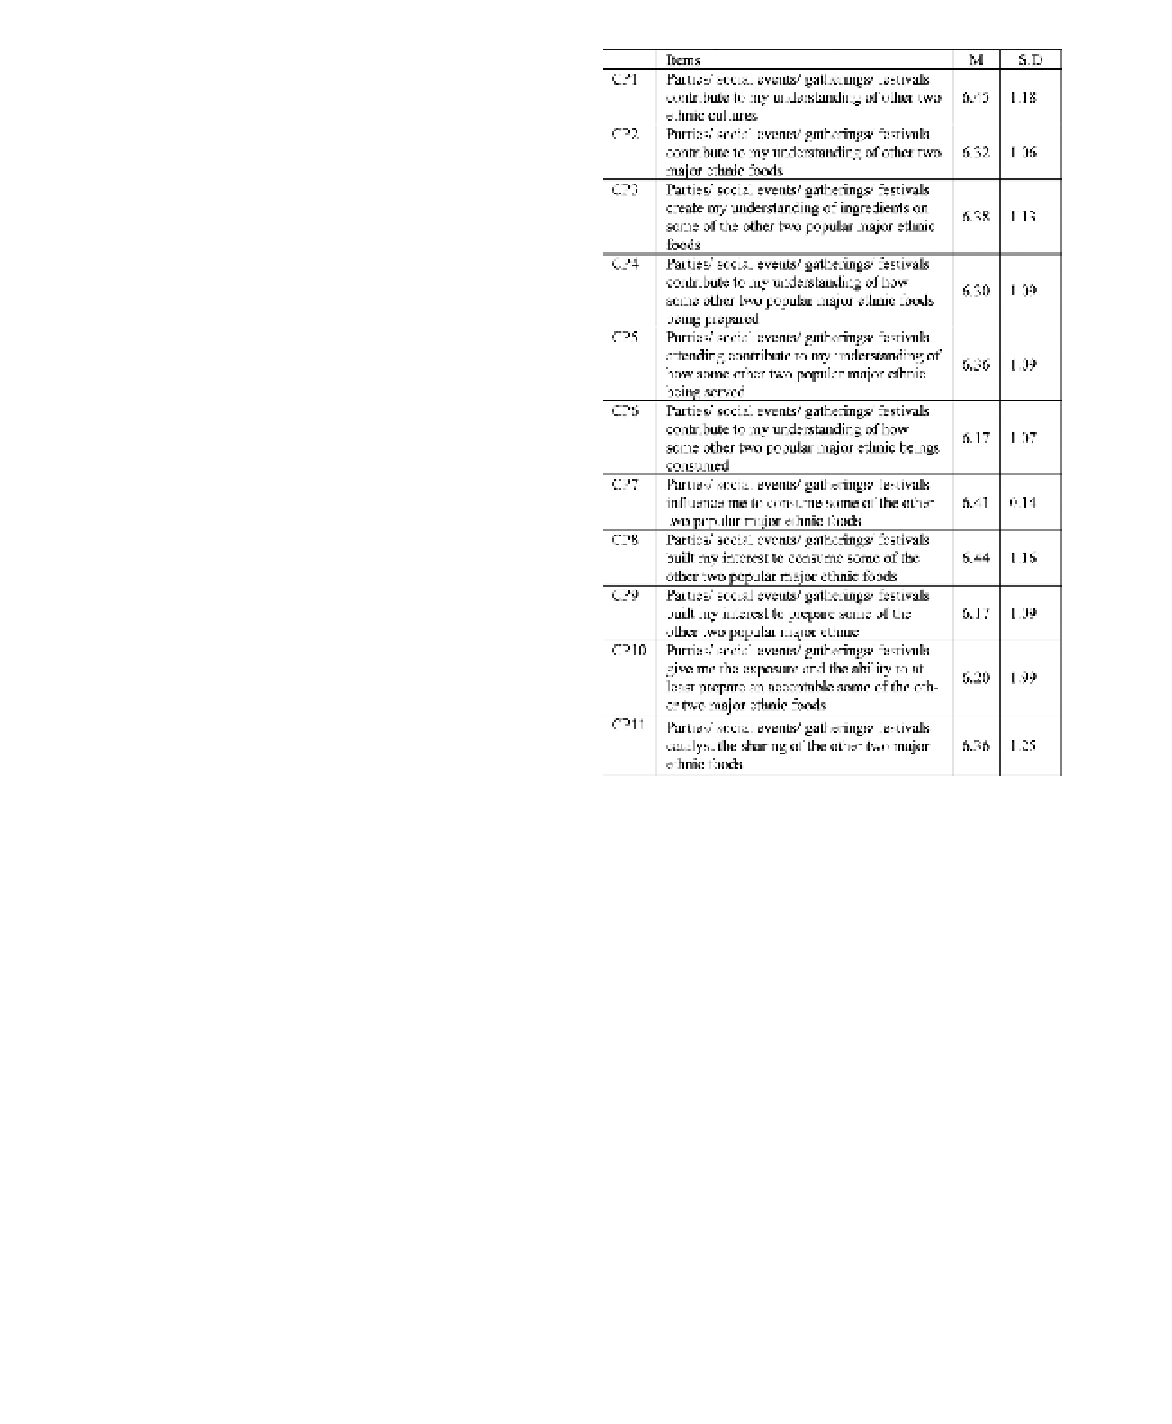
Table 1. Results of mean and standard deviation of
social interaction through event (
n
=
392).
4
ANALYSIS AND RESULT
Based on frequency, Malays constituted around
60.2 percent (n
=
236) followed by Chinese by 21.7
per cent (n
85), Indian with 16.6 per cent and
other ethnic groups with 1.5 percent (n
=
6). This
proportion did provide a reasonable representa-
tion of ethnic ratio in Malaysia which consists of
60:30:10 (Malay, Chinese and Indians).
=
4.1
Perception of social interaction toward food
preparation and consumption
This section analyzes perception of social interac-
tion toward food preparation and consumption. As
shown in Table 1, the magnitude of mean scores
above 6.00 to below 7.00 indicates that the majority
of respondents in the sample agree with the state-
ment related to social interaction as the point that
they understand and learnt each other ethnic food.
The respondents agrees that parties/social gath-
ering creates their understanding of each other eth-
nic cultures (
M
Scale: 1 = Strongly Disagree, 2 = Disagree, 3 = Slightly
Disagree, 4 = Neutral, 5 = Slightly Agree, 6 = Agree,
7 = Strongly Agree.
them the exposure and the ability to at least pre-
pare an acceptable some the other ethnic foods
(
M
6.20, item CP10) thus catalyst the sharing of
the other ethnic foods (
M
=
=
6.36, item CP11).
=
6.45, item CP1), food (
M
=
6.32,
4.2
Comparison between ethnics perception
of social interaction toward food preparation
and consumption
Analysis of Variance (ANOVA) was undertaken
looking at the differences between perception of
three ethnic groups (Malay, Chinese and Indian)
on the social interaction toward food preparation
and consumption. In addition, post hoc multiple
comparisons using the Scheffe test was also applied
to see the underlying differences within the ethnics
group.
Ethnics respondent strongly agrees that social
events, gatherings and festivals contribute to their
understanding of each ethnic food culture (Malay,
M
item CP2) and ingredients (
M
6.38, item CP3).
Their knowledge and understanding on how other
ethnic foods being prepared also enhanced and
this can be seen through mean the score (
M
=
6.30,
item CP4) given this item. Similarly, the respond-
ents agree parties/social event/gatherings/festivals
attending contribute their understanding of how
some other major ethnic being served (
M
=
=
6.36,
item CP5) and consumed (
M
6.17, item CP6)
and further influence them to consume the foods
(
M
=
6.41, item CP7). Parties/social events/gather-
ings/festivals also built their interest to consume
(
M
=
6.17,
item CP9) some of the popular other ethnic foods.
Parties/social events/gatherings/festivals also give
=
6.44, item CP8) and to prepare (
M
=
=
6.55, Indian,
M
=
6.52 and Chinese,
M
=
6.52,


Search WWH ::

Custom Search