Travel Reference
In-Depth Information
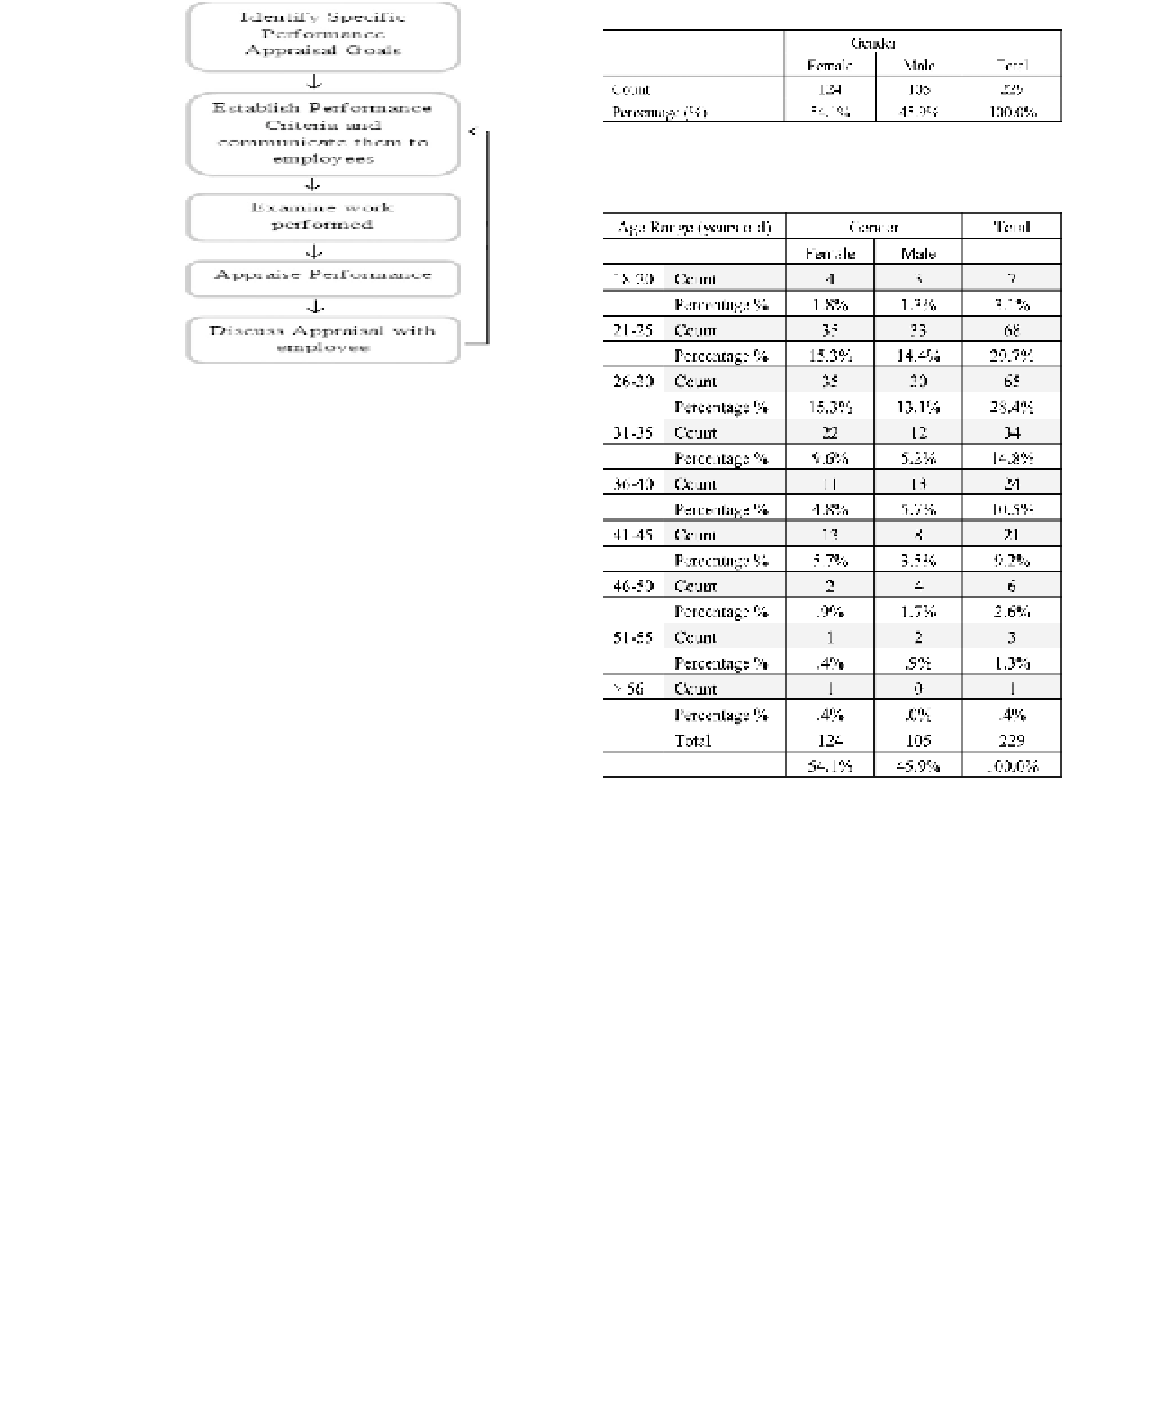
Table 1.
Respondents' gender.
Table 2.
The distribution of respondents' age range by
gender.
Figure 2. The performance appraisal process (Wayne,
2008, p. 213).
on Fortune 100 best companies in the US have
found that the most highlighted issue pertains to
performance apprasial practice raised by Ameri-
can employees are; 1) the accepted performance
appraisal system by those who are being rated, 2)
fairness during the appraisal process, 3) employees'
perception towards the results (fairness), 4) types
of response given by the employer, and 5) the effec-
tiveness of the performance appraisal program.
3 METHODOLOGY
In this study, the respondents selected in this study
were those who work in the hotel industry. The
questionnaire and email were randomly distrib-
uted to the selected population. The researcher
distributed 200 printed questionnaires and 100
emails, which made up of 300 questionnaires. The
majority of the questionnaires were distributed
within the 4 and 5 stars hotels in Klang Valley. This
strategy was employed due to the density of well-
structured hotel exists in Klang Valley. As a result,
229 responses were successfully gathered which
representing 76.3 percent response rate. Using the
5 point Likert's Scale to measure the responses
(Strongly Disagree
of them are female, which represent 54.1 percent
and 105 respondents are male that represent 45.9
percent of the whole sample population. It shows
that female pose the highest percentage and domi-
nated the sample for this study. The distribution of
respondents by gender is presented in Table 1.
4.1
Age range
In this analysis, it was found that the highest hotel
employees' age range is within 21-25 with the total
of 29.7 percent of the sample. The second highest
hotel employees' age range is within 26-30 with the
total of 28.4 percent. The smallest percentage of
the hotel employees' age range is 0.4 percent of the
age range above 56. Table 2 depicts the age range
of the hotel employees.
5).
The questionnaire consists of two sections adapted
from Khatri (2000) and Tsaur and Lin (2004).
=
1 and Strongly Agree
=
4 FINDINGS
4.2
Length of employment with current employer
Based on the data collected, it shows that the
majority of the respondents have worked with their
current employers for more than 2 years, which rep-
resents 21.4 percent of the population. Moreover,
This section will be divided into two segments which
are; (i) descriptive analysis (demographic) and (ii)
principal component analysis (compensation and
performance appraisal). From the analysis, it was
found that out of the 229 of total respondents, 124


Search WWH ::

Custom Search