Information Technology Reference
In-Depth Information
100%, while the RE method does not. Also, for more than half of the cases, the KS
D
statistic becomes worse as sample size increases when using RE. We believe there
are fundamental flaws in this method. It fails to capture the dependence structure
between nodes and edges.
Figure 6 summarizes the same results using the KLD measure. Again the FF
method tends to converge toward 0 whether sample size increases, and is generally
lower (better) than the RE method at all sample sizes.
Figure 7 displays the KS
D
statistics of the cluster coefficient distribution esti-
mations. Unlikely the degree distribution, the the cluster coefficient distributions are
not cumulative probability distributions. In order to apply the KS
D
statistic, they
need to be transformed and standardized. Hence, the KS
D
statistic won't be able to
detect systematic under- or over- estimations. Figure 8 displays the KLD statistics of
the cluster coefficient distribution estimations. Based on these two figures. We can
draw a similar conclusion: our approach outperforms the RE o method in accuracy
and improvement in accuracy with larger sample sizes.
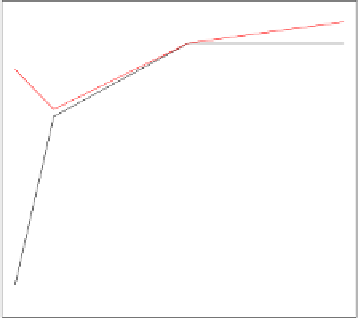
Rank Correlation
between estimated CC and true ego CC
RE
FF
0.2
0.4
0.6
0.8
%Edges Sampled
Fig. 9
Correlation between estimated CC and true CC
In contrast to Figures 8 and 7, Figure 9 looks at the unconditional CC of the ego
network, i.e., the average CC of all nodes. It shows that the rank correlation (Spear-
man correlation) between the estimated CC and the true ego CC is very strong. We
can see that even with a small sample size, e.g., 20
30% of the total edges, we
are able to estimate the rank of the ego networks by CC reasonably well. In other
words, we can tell which web sites have richer local structure only by relatively
small ego sampling. This is a significant validation of our ego-centric approach to
viral marketing.
−