Information Technology Reference
In-Depth Information
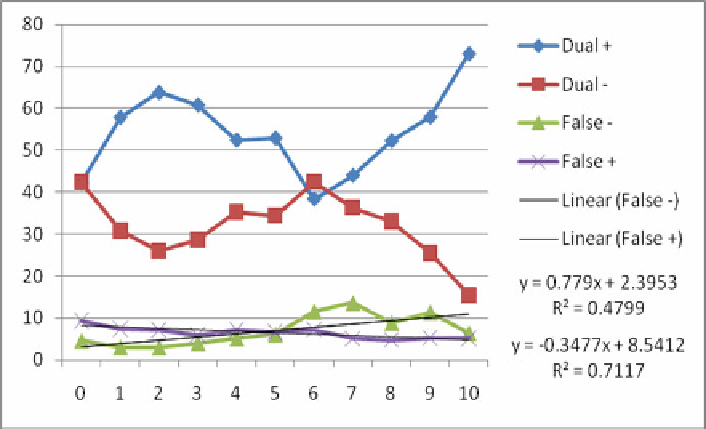
Fig. 3
Correlates the sum of observed closeness to each connected individual on the
x axis and participant accuracy on the y axis. The data show evidence of an increased
rate of false positives as participants increase in closeness to the connected individuals.
The dip at a connection value of 10 in the rate of false positives, or a connection value of
5 to each user, may be attributed to the low number of responses fitting these criteria.
(n = 14,051)
Demographic data on the user base was also collected focusing on age, birth
location, sex, education, and regional affiliations. Insufficient data was collected
for analysis on any metric other than sex. Hypothesis testing showed sex to be an
insignificant predictor (n = 166, σ = 13.94, μ = 87.6, p < 0.05).
4.2 Connection Intensity
Granovetter postulated that people maintain many more weak ties than strong ties,
and Donath extended this hypothesis by claiming that online networks would
enhance the number of these ties. Early candidate metrics from Facebook indicate
that users may also maintain more strong ties. Offline research has indicated that
people maintain approximately 8-10 strong ties from an assumed average of 150-
250 friends. These data indicate that people maintain approximately 40 strong ties
and 185 weak ties over an average of 483 friends. Assuming no increase in friend
group size, these data indicate that online strong ties lie outside the expected
range, with a proportionately smaller but absolutely larger group of weaker ties.
Figure 5 describes results for each type of connection in more detail. Overall the
data indicate that one's group of Facebook connections that also exist in the real
world represent the strongest type of connections.
In Figure 4, N/A indicates a non-response, and should have a frequency at 0
intensity approaching 1. FB indicates a connection that is only present on Facebook,