Biomedical Engineering Reference
In-Depth Information
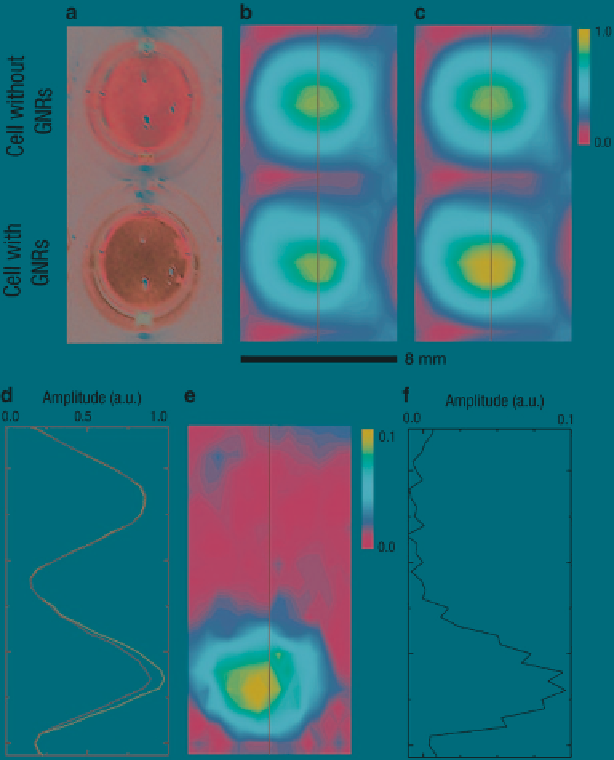
Fig. 7
Cancer cell images with and without GNRs. (
a
) Visible image; (
b
) THz image without IR
irradiation; (
c
) THz image with IR irradiation; (
d
) amplitudes along the lines in (
b
) (
black
) and (
c
)
(
red
); (
e
) differential image between (
b
) and (
c
); and (
f
) amplitude along the line in (
e
) (From Oh
et al. (
2009
). Copyright © 2009 by Optical Society of America. Reprinted by permission of
Optical Society of America)
resulting from the temperature rise caused by the surface-plasmon resonance.
The cell without GNRs did not show any change regardless of IR irradiation.
Although the increase in reflectivity was small (less than 10%), the contrast became
evident when the difference was measured between Figs.
7b, c
to give Fig.
7e
. The
differential THz image from the cell without GNRs was negligible, but that from
the cell with GNRs showed clear evidence of nanoparticle distribution. The ratio
between the amplitudes with and without GNRs was approximately 30. Therefore,
very-high-contrast THz molecular imaging can be accomplished for the sensitive
monitoring of nanoprobe delivery.
Search WWH ::

Custom Search