Environmental Engineering Reference
In-Depth Information
of fi sh or shellfi sh was associated with increasing mercury
levels (
p
100
0.01 for trend test for geometric mean and preva-
% >20 µg/L and <100 µg/L (1)
% >5.8 µg/L (2)
90
lence
5 µg/L). Almost half of adult Asian New Yorkers (46.2%)
had blood mercury levels
5 g/L. Among the foreign-born
Chinese New Yorkers in the survey, 73% had blood mercury
concentrations
79
80
15 µg/L
(McKelvey et al., 2007). These epidemiologic studies point to
the fact that the body burden of a signifi cant fraction of the
population of United States is elevated but the health conse-
quences have not been fully assessed.
5 µg/L, and 20% of these were
68
70
60
50
40
Disparities in Siting of Mercury Sources
35
Industrial sources of mercury in the environment are a
major environmental health issue because they tend to
be located in predominantly built-up areas, especially in
communities of color and socioeconomically depressed
neighborhoods. Incinerators and coal-fi red power plants
are notorious emitters of mercury because the pollution-
control devices in these plants are not 100% effective in
removing gaseous mercury from waste gas streams. In a
detailed assessment of industrial emissions of mercury into
the air in the Great Lakes basin during 1999-2000, Murray
and Holmes (2004) showed that coal-fi red electric utilities
accounted for 52.7% of the region's mercury emissions,
varying from 20.2% of the total in New York to 67.5% in
Ohio. Chang et al. (2000) reported that mercury removal
effi ciencies of pollution-control devices of two large-scale
municipal solid-waste incinerators in Taiwan were less
than 50%. Much of the mercury was emitted as oxidized
mercury. Similar results were observed by Lee et al. (2004),
who measured percentages of elemental mercury in the
fl ue-gas emissions of 9.5-31.4% from coal-fi red power
plants and 1.3-3.7% from industrial-waste incinerators in
Korea. Other important contributors to regional emissions
included municipal-waste combustion (5.6%), mercury-
cell chlor-alkali plants (4%) and hazardous waste incinera-
tors (4%), stationary internal combustion engines (3.5%),
industrial, commercial, and institutional boilers (3.3%),
and lime manufacturing (3.0%). Medical-waste incinera-
tion accounted for 1-4% of the regional emissions. These
types of factories are characteristically found in the old
parts of towns, where environmental justice communities
tend to aggregate (Atlas, 2001). Indeed, the United States
General Accounting Offi ce in 1983 stated that 75% of off-
site commercial hazardous waste facilities in EPA Region 4
were located in African-American neighborhoods, the resi-
dents of which make up 20% of the region's population.
The fact that in the early 20th century, local zoning
bodies routinely zoned many residential African-American
communities as “industrial” while zoning similar regions
in white communities as “residential” is well documented
(Bullard, 1994). Such residential segregation via zoning
ordinances would inevitably create unequal distribution
of ethnic minorities and low-income people around the
mercury-emitting factories.
30
27
20
16
16
10
10
3
3
00 0
0
0
0
0
0
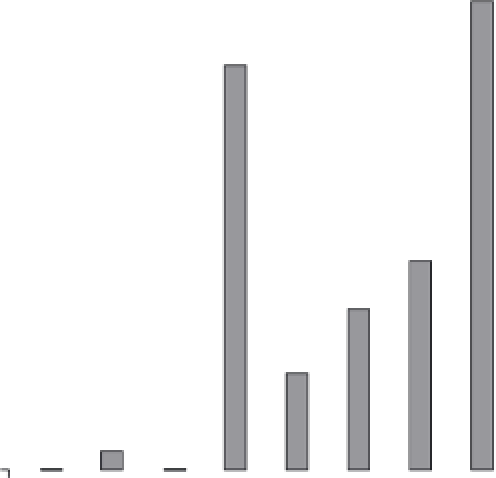
Ethnicity-Region
FIGURE 15.1
Maternal blood guideline exceedances for organic
mercury in Arctic Canada, by region and ethnicity. (
Source:
Van
Oostdam et al., 2005.)
had blood mercury levels
5.8 µg/L and 10.9% had levels
3.5 µg/L (Hightower et al., 2006). Another observation
from the NHANES database that was of equal concern was
that about 8% of all U.S. women of childbearing age were
found to have blood mercury levels
5.8 ppb, a level con-
sidered by the USEPA to cause an increased risk of adverse
health effects to babies (Woodruff et al., 2003). Native
Americans, Asians immigrants, and Pacifi c Islanders rep-
resent a high-risk group for dietary exposure to methyl-
mercury as evidenced by the fact the mean number of fi sh
and shellfi sh meals consumed by this particular racial/
ethnic group was higher than the average for the gen-
eral population (Figure 15.1). The lowest fi sh and shell-
fi sh consumption rate was by Mexican Americans, and
this population also had the lowest blood mercury levels
(Figure 15.1).
Biomonitoring of blood mercury concentrations in a rep-
resentative sample of 1811 New York City (NYC) residents as
part of the NYC Health and Nutrition Examination Survey
found the geometric mean blood mercury concentration
among NYC adults to be 2.73 µg/L (McKelvey et al., 2007).
About one quarter (24.8%) or 1.4 million NYC adults, had
blood mercury concentrations equal to or exceeding the New
York State reportable level of 5 µg/L. The 97.5th percentile
for blood mercury concentration for all participants was
15.37 µg/L. Women 20-49 years of age (n
1049) had a geo-
metric mean blood mercury level of 2.64 µg/L with a 23.8%
prevalence of blood mercury
5 µg/L. Frequent consumption