Environmental Engineering Reference
In-Depth Information
B
A
Total mercury
surface water,
November 2005
Methylmercury
surface water,
November 2005
Total mercury
mosquitofish,
wet season, 1995
Total mercury
mosquitofish,
wet season, 2005
ng/L
g/kg
0.4
400
0.3
300
0.2
200
0.1
100
0
0
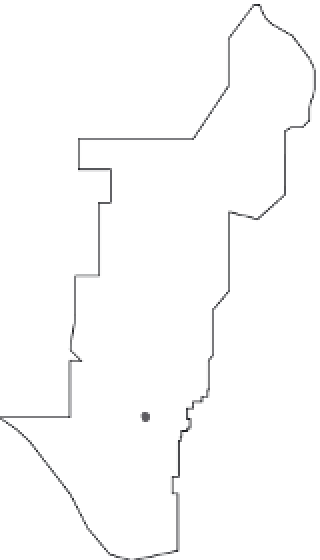
FIGURE 9.4
(a) Spatial patterns of mercury concentrations in mosquitofi sh during wet season sampling 1995 and 2005. (b) Spatial patterns in
total mercury concentrations in surface water during November 2005 (left) and MeHg concentrations in surface water (right) for the Everglades.
(
Source:
Data were obtained from the United States Environmental Protection Agency REMAP [USEPA, 2007b]).
FIGURE 9.5
Conceptual diagram illustrating the spatial patterns in mercury and associated water chemistry in the Everglades. There is a
north to south gradient in total mercury, sulfate, porewater sulfi de, total phosphorus, and dissolved organic carbon (DOC). The sulfate, total
phosphorus, and DOC largely originate from the Everglades Agricultural Area. High porewater sulfi de and/or DOC may limit the formation of
methylmercury in the north. Lower concentrations of porewater sulfi de and DOC toward the south may allow the formation of methylmer-
cury in the central Everglades. A peak in fi sh mercury concentrations in the center of the Everglades and into the Everglades National Park
may be due to this spatial pattern of methylmercury production coupled with decreases in phosphorus, which limits fi sh production and
increases mercury concentrations.