Geoscience Reference
In-Depth Information
100%
8
98
544
90%
5508
30
112
Stewardship
80%
125
1798
342
110
Scale
70%
14
3554
356
Monitoring
92
60%
18
39
70
Management
50%
380
5238
16
74
16
Methods
40%
332
49
LTER
3256
24
30%
264
17
Location
336
1470
20%
7
Event
26
3452
528
45
10%
1516
46
6
10
96
0%
A
B
C
D
E
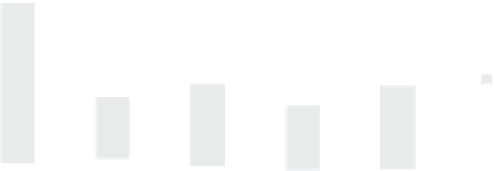
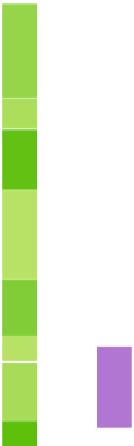
Fig. 13.6
Number and relative percentage each of the defi ned research concepts within the accu-
mulated number of LTER publications produced by researchers based at each of the geographical
zones, A to E. Geographical Zone F is not included because all researchers in Antarctica are from
other parts of the world. For latitudinal ranges and countries included in geographical Zones A to
E see Table
13.1
Table 13.4
ISI titles published from each Zone. For latitudinal ranges and countries included in
Zones A to E see Table
13.1
Zone
Number of ISI titles
Fraction of ISI titles (%)
A
112
0.64
B
15,734
89.33
C
706
4.01
D
500
2.84
E
561
3.19
TOTAL
17,613
100.00
ILTER publications generated in the Northern Hemisphere accounts for 94 % of
the world's total. Therefore, for ILTER ISI publications the Northern/Southern
Hemispheres ratio is even greater than 9:1.
Most LTER research outputs listed on LTER bibliographies are not published
in ISI journals (Fig.
13.7
).
11
Notably, networks in regions with numerous local
11
It is important to note that there are an unknown number of LTER research outputs that are not
listed in bibliographies, and the national and site-level bibliographies themselves are often incon-
sistent in what they report as publications.


Search WWH ::

Custom Search