Information Technology Reference
In-Depth Information
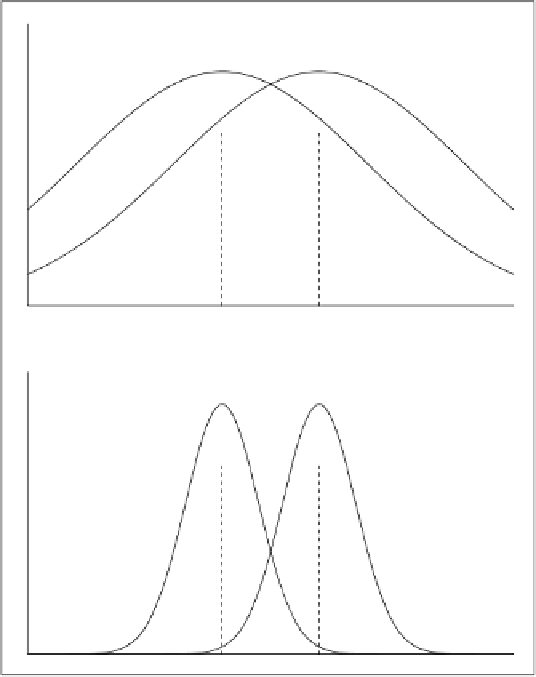
Fig. 15.1
Hypothesis tests. In the
upper
figure, the means are different, but there is a reasonable
likelihood that the samples are drawn from the same population, as the distributions have high
overlap. In the
lower
figure, the means are different, and the distributions are well-separated; a
hypothesis test should identify that these samples are drawn from different populations
of normal distributions in which the means are different. In the upper graph, the
distributions cover much of the same area; most of the points under one are under
the other. Intuitively, it seems quite possible that a single underlying population is
involved, and that the differences are due to the randomness of sampling choosing
slightly larger instances in one case than in the other. In the lower graph, the distri-
butions barely overlap at all. For the same underlying population to be involved, the
sampling process would have had to be highly biased, choosing first a series of small
values and then a series of high values. It seems improbable that this could happen
by chance, so we conclude that the samples are in all likelihood drawn from separate
populations.
There is a variety of hypothesis or significance tests. Choice of test depends on
factors such as whether experimental outcomes are binary, or if there are scores are
available; whether multiple tests are run on the same data, or if different tests were