Information Technology Reference
In-Depth Information
100
1500
80
60
1000
40
500
total size
space wastage
20
0
0
25
30
35
40
45
50
List length
F
IGURE
2.
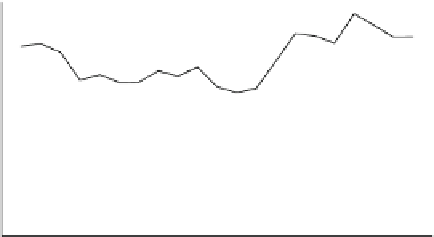
Size andspace wastage as a function of averagelistlength.
100
Total size
1500
80
60
1000
40
Space wastage
500
20
0
0
30
35
40
45
50
List length
F
IGURE
2.
Size andspace wastage as a function of averagelistlength.
Fig. 11.3
Two functions plotted on one graph. It is necessary to label the axes to correspond with the
curves; otherwise it would be difficult to identify which curve matched which axis. Axes are labelled,
so that a reader can easily identify which one matches which curve. The
lower
version is a revision of
the
upper
, with distracting elements removed or de-emphasised and several other minor alterations
time, as different asymptotic growth rates give straight lines of different slope. In par-
ticular, if variables
x
and
y
are related by
y
ax
c
, then log
y
c
log
x
, that is,
the relationship of the logarithms is linear. If the relationship is more complex, some
sort of transformation on the data may yield a straight line or some other simple curve.
Log scaling is not always appropriate. If one algorithm is 30 % faster than another
at all scales, then, depending on overall scale, their performance could be almost
indistinguishable on a log-log graph, although the constant-sized gap would be
=
=
log
a
+