Information Technology Reference
In-Depth Information
0.20
0.15
0.10
Standard
Enhanced
Blended
0.05
0.00
0
5
10
15
20
25
30
Number of elements inspected
F
IGURE
7.
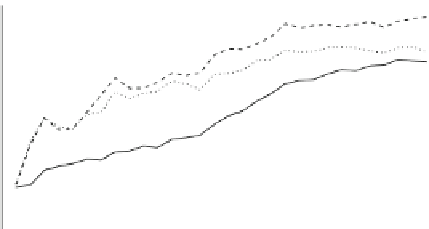
Success rate asthe number of inspected itemsisincreased. It is
clearthatblending is not effective.
0.20
Standard
0.15
0.10
Enhanced
Blended
0.05
0.00
0
5
10
15
20
25
30
Number of elements inspected
F
IGURE
7.
Success rate asthe number of inspected itemsisincreased. It is
clearthatblending is not effective.
Fig. 11.2
Graphs reconsidered. These graphs show the same data as those on the previous page.
Vertical scale is now completely corrected, and unnecessary tick marks have been removed. In the
lower
version, the data lines are stronger and the legend has been replaced with direct labelling.
Line ticks have been introduced to reflect the fact that the data is discrete, that is, non-integer values
are not meaningful
where it can't be confused with other material; default placement may mean that
the legend obscures part of a curve. The emphasis is on creating as much space as
possible for presentation of data, while other elements are held to a minimum.
Imagination may be needed to allow the desired picture to emerge. Logarith-
mic axes are useful because they show behaviour at different orders of magnitude.
An example of changing to a logarithmic axis is shown in Fig.
11.4
. Graphs with
logarithmic axes are also useful when plotting problem size against algorithm running