Biology Reference
In-Depth Information
there is no need for any electrophoresis and data capture is almost completely
automated. SNPs are also far more abundant than SSRs and so there is also
a potential for running genome-wide association or linkage disequilibrium
(LD) studies rather than conventional QTL detection.
Classical QTL analyses rely on the development of experimental
biparental mapping populations that generally have little or no commercial
value. The population is then phenotyped, mapped with genetic markers and
the QTL identified over several environments, but always in the same genetic
background. Some common, major QTLs have been identified in different
sunflower populations, as described in previous sections, but in general it is
not known whether a QTL will function when introgressed into different elite
lines. This whole process is rather slow and cumbersome and so a lot of effort
is now being invested within private industry on LD mapping in order to
identify QTL that function in a wider range of genetic backgrounds. The
success of this strategy is dependent on the extent of LD within the genome
and the current estimate for cultivated sunflower is, on average, less than six
kilobases (Kolkman et al. 2007), which equates to a fraction of centiMorgan.
However, due to selection pressure, LD may extend further around loci of
economic interest such as the recessive branching gene on LG 10 in elite male
inbred lines
(Fig. 7-1)
.
Molecular technology is evolving extremely rapidly
and very high density maps have or will become available for most
economically important crop species, and eventually even the complete
B Lines
R Lines
Upper P Value
<0.01
Upper P Value
<0.01
ORS541b
ORS889
ORS878
ORS1088
ORS078
ORS595
ORS437
ORS537
ORS363
ORS380
ORS613
ORS974
ORS853
ORS1144
ORS1238
ORS691
ORS541b
ORS889
ORS878
ORS1088
ORS078
ORS595
ORS437
ORS537
ORS363
ORS380
ORS613
ORS974
ORS853
ORS1144
ORS1238
ORS691
<0.01
<0.01
<0.001
<0.001
<0.0001
<0.0001
Lower D
Lower D
1.00
0.90
0.80
0.70
0.60
0.50
0.40
0.30
0.20
0.10
0.00
1.00
0.90
0.80
0.70
0.60
0.50
0.40
0.30
0.20
0.10
0.00
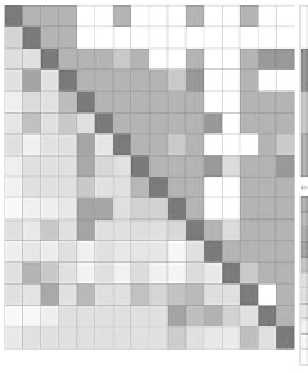
Figure 7-1
Two TASSEL (Bradbury et al. 2007) outputs, which were produced by analyzing
the male and female lines separately from a total panel of 192 elite inbreds, genotyped with
16 public SSR markers on LG 10. Several regions of high LD, between tightly-linked SSR
markers (as measured by the D'statistic—
shown below the black diagonal line
), can clearly be
seen in the R lines (
shown in the right-hand panel
), but these regions are completely absent
from the B lines (
shown in the left-hand panel
). The recessive branching gene (
b1
) is located in
between ORS1088 and ORS437 and selection for this trait in elite R lines has resulted in a
reduction of the allelic diversity at linked SSR loci (Combes and Berry, unpub data).


Search WWH ::

Custom Search