Databases Reference
In-Depth Information
calculated, as mentioned earlier, as 1 / "number of distinct values," which in this case
would be 1 / 266, which is 0.003759399 as shown on the first density value on Listing 3-7.
So, the Query Optimizer can use the density information to estimate the cardinality of
GROUP
BY
queries.
GROUP
BY
queries can benefit from the estimated number of distinct
values, and this information is already available in the density value. If you have this
density information, then all you have to do is to find the estimated number of distinct
values by calculating the reciprocal of the density value. For example, to estimate the
cardinality of the following query using
GROUP
BY
ProductID
, we can calculate
the reciprocal of the
ProductID
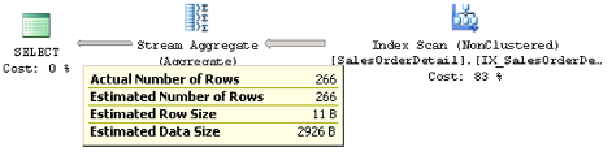
density shown in Listing 3-7. In this case, we have
1 / 0.003759399, which gives us 266, which is the estimated number of rows shown on
the plan in Figure 3-1.
SELECT
ProductID
FROM
Sales
.
SalesOrderDetail
GROUP BY
ProductID
Listing 3-8.
Figure 3-1:
Cardinality estimation example using a GROUP BY clause.
In a similar way, to test
GROUP
BY
ProductID
,
SalesOrderID
, we would need
1 / 8.242868E-06, which give us 121,317, which you can also verify by obtaining that
query's graphical plan.
Listing 3-9 is an example of how the density can be used to estimate the cardinality of a
query using local variables.