Agriculture Reference
In-Depth Information
A would have the least amount of slope,
while slope C would have the greatest or
steepest percent of slope. In Figure 3.6-B
we can see another graphic means of
visualizing the relative differences in
slope steepness by how close or far apart
the topographic contours are spaced.
Area A in Figure 3.6-B has contours that
are widely spaced apart, as compared to
areas B and C. The contours in area C
are relatively closely spaced, resulting in
terrain that is steeper or has a higher
percent of slope than areas A and B.
D
30%+
C
20-30%
A
5-10%
B
10-20%
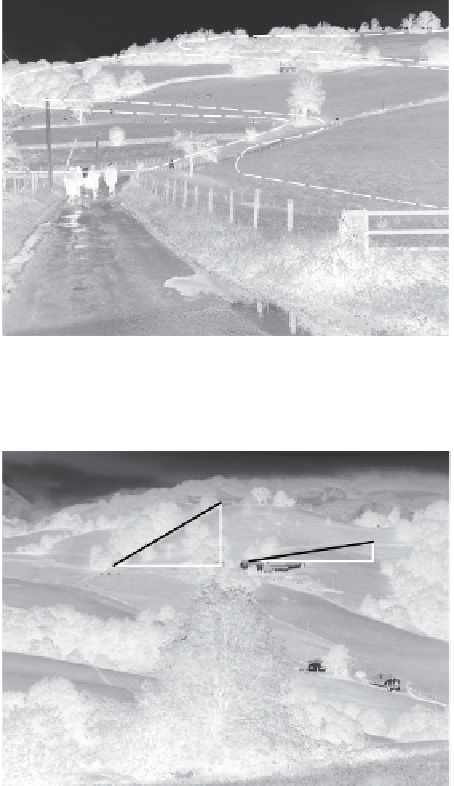
Figure 3.5
Photographic visualization of four different
degrees of slope, with area A the least steep and area D
the steepest slope in the landscape scene
C
A
A
S
C
V
S
V
H
H
S
V
H
B
B
Figure 3.6-B
Visualizing the difference of steep to shallow
sloping terrain by the spacing of contours
Figure 3.6-a
Visualizing various categories of slope with
different slope triangles
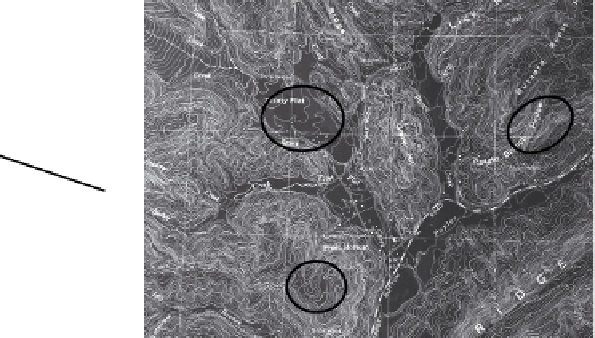
To determine the actual slopes found in each area (A, B, C, D), the
percent of slope would be calculated based on measurements taken
from a topographic survey with contours. Figure 3.7 shows how slope is
calculated using an engineer's scale and a USGS quad map.