Information Technology Reference
In-Depth Information
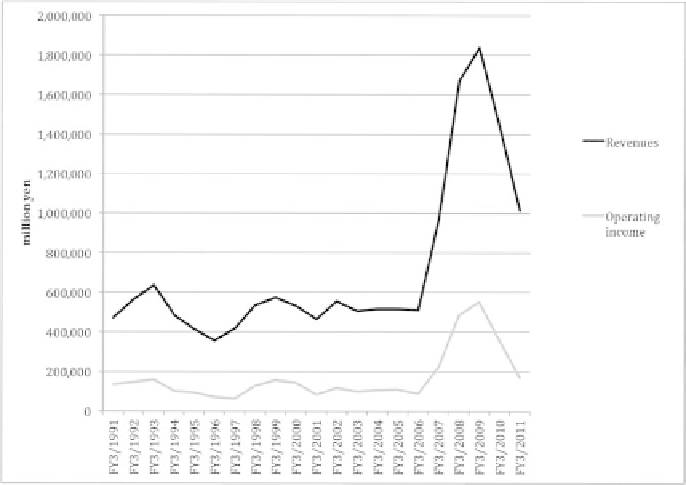
The Wii together with Nintendo's handheld DS system created a rapid
increase of revenues and improved the fi nancial performance of the company
during FY 2006-2009; revenues more than tripled and operating income
margin (ROS) increased from 17.7 per cent to 30.2 per cent (
Figure 8.1).
The
fi nancial performance during this period has to be understood against the
underlying business model of the hardware system and its software. Unlike
the competing system that initially sold their hardware systems for a loss,
Nintendo's less costly technology enabled them to break-even, even at the
beginning of the product's life cycle. Furthermore, development costs of
games were signifi cantly lower than for competing systems. Surveys of Japa-
nese game companies indicate that the average development cost for a game
in the Wii system during the period 2006-2010 was 39 per cent of an average
PlayStation 3 game and 62 per cent of an average Xbox 360 game.
Compared to other hardware manufacturers, Nintendo has had a more
dominating position in video game software publishing. This has been
notable in Japan where Nintendo has been the leading video game pub-
lisher during the last decade (Media Create, 2011). Accordingly, Ninten-
do's own in-house software development managed to gain a dominating
position at the Wii platform. At the Japanese market, Nintendo published
74 per cent of all game units sold on the Wii platform during the period
2006-2010, compared to Sony Computer Entertainment that published
nese sales data also imply that Nintendo had considerably higher average
2,000,000
1,800,000
1,600,000
1,400,000
Revenues
1,200,000
ft
>.
| 1,000,000
I
Operating
income
800,000
600,000
400,000
200,000
rHcvjrotfinvot
^coo'O
^HCsiin-'i
-mvot^cca^o^
cr
.(7>(7
><T
»<7*(7
\a\<T>a>oooooooooot
-t»-i
o>o»o*ff><j>ovo*ey>o>oooooooooooo
HHHHHHHrlHNNNNNNNNNNNM
\ \ \ \ \ \
£££££££££££££££££££££
0
Figure 8.1
Nintendo revenues and operating income, FY 1991-2011 (March 31).
Search WWH ::

Custom Search