Environmental Engineering Reference
In-Depth Information
Fig. 4
An FTL transport
chain
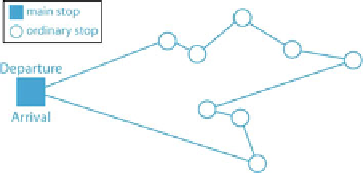
Fig. 5
An LTL transport
chain
considered since the main determinants of a trip are related to the delivery or
pickup operation, independently of the load transported (Fig.
5
).
From the three surveys a grid was built to estimate the number of main and
secondary stops for each establishment according to the activity served and the
management mode. Knowing the type of vehicle used for the freight transport, it is
also possible to determine the average size of the round by type of management
mode (third party transport, own account as consignee or own account as for-
warder). Thus round the movements simulated in step 1 can be characterized as
main stop or ordinary stop.
The details on model calibration can be found in Routhier and Toilier (
2007
).
4.2.3 Distance Generation
In order to calculate the distances travelled, the FRETURB model proposes three
types of functions. Each of them related to one of the trips described above (direct
trips, starting/ending trips and connecting trips) (Table
2
).
Table 2
Percentage of main trips in LTL trip chains Toilier et al. (
2005
)
Activity
Third party (%)
Own account as
consignee (%)
Own account as
forwarder (%)
Agriculture
0
100
75
Craftsmen
2.13
39.24
18.21
Small retail stores
1.85
65.38
7.43
Wholesale
6.7
68.62
31.76
Warehouses
65.06
58.33
62.67
Department stores
5.57
81.81
13.63
Industry
9.48
46.80
38.84
Tertiary
3.82
56.25
14.58


Search WWH ::

Custom Search