Information Technology Reference
In-Depth Information
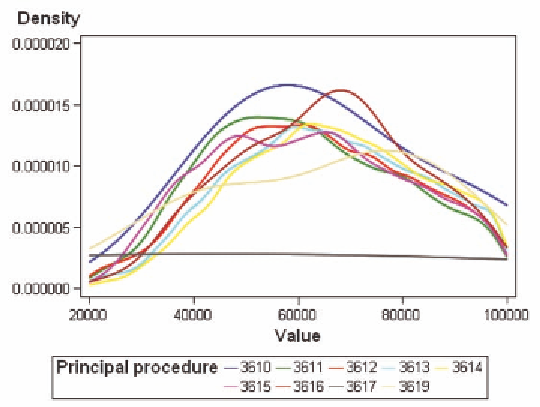
Figure 24. Total charges by procedure
Figure 25 shows the length of stay by hospital. As shown, stay differed considerably by procedure
and by hospital. Hospital #6 has the greatest probability of a shorter length of stay compared to the other
hospitals. Hospital #2 has the highest probability of a longer length of stay. Hospital #7 tends to be in
the middle in probability for both a high and low length of stay, as is hospital #1.
Figure 26 shows the total charges compared by hospital. There is a definite shift in the curves, indi-
cating that some hospitals charge far more compared to other hospitals, especially hospitals #3 and #9.
Hospital #1 has the lowest charges, reinforcing the fact that it performs a procedure that is less risky
Figure 25. Length of stay by hospital for cardiovascular surgery

Search WWH ::

Custom Search