Information Technology Reference
In-Depth Information
than 1/10 of the cost of prophylactic treatment per patient. If the cost of treatment is 100 times the cost
for prophylactic treatment, then the best model is a decision tree with an average cost that is ½ of the
cost of prophylactic treatment per patient. In other words, as the cost of treatment of MRSA increases,
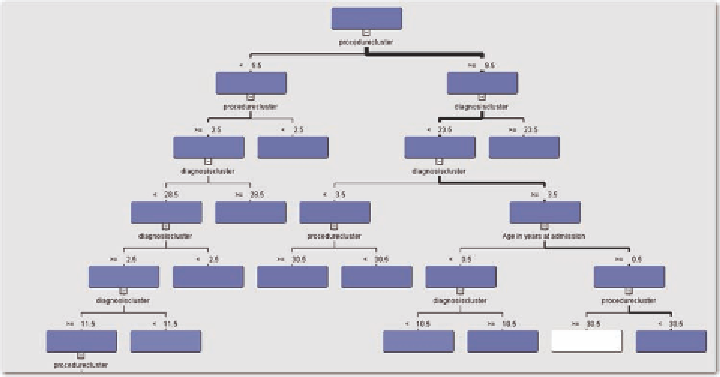
more patients are targeted for prophylactic treatment. The decision tree is given in Figure 30. Note that
because the procedure clusters and diagnosis clusters are defined as interval variables, the splits occur
based upon a numbered level.
Note that the procedure clusters are more prominent compared to the diagnosis clusters when defining
the decision tree. Note also that there is a combination of procedure cluster and diagnosis cluster used
in determining risk for MRSA. Only one patient demographic, age, is used in the tree, and then, only
on one branch. In other words, it is the diagnosis and procedure more than the demographics that are
important in determining patient risk. The corresponding ROC curve is given in Figure 31. It appears
to be a good fit in terms of both specificity and sensitivity.
Figure 30. Decision tree with a cost of treatment that is 100 times the cost of prophylactic treatment
Figure 31. ROC curve

Search WWH ::

Custom Search