Information Technology Reference
In-Depth Information
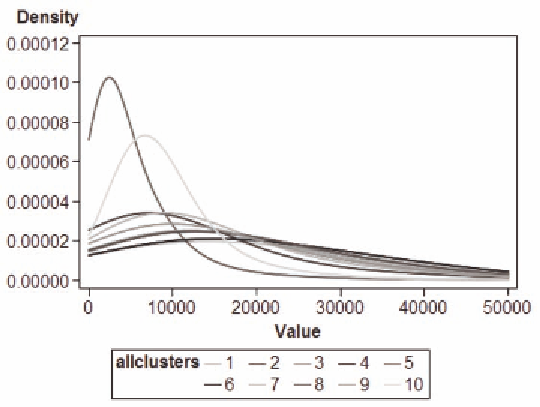
Figure 2. Probability density for total charges
because the facilities in the NIS exclude psychiatric institutions so that those patients with severe prob-
lems are discharged to other providers that are more specific to their diagnoses. Cluster 6, with more
mild co-morbidities, is also on the lower end for both length of stay and total charges, but a slightly
higher risk of mortality. Figure 1 gives the probability distribution for length of stay; Figure 2 gives the
probability for total charges. We want to see if there is a hierarchy embedded within the kernel density
distributions that can identify the order of severity.
From the distribution, 2<10<4<7<3<1<5<9<6<8 for length of stay. We define this ordering by the
probabilityof having a length of stay between 0 and 4 days. The higher the curve, the greater the prob-
ability of having 0-4 days of stay. There is a crossover point where the ordering changes, so that the cluster
with the lowest probability of a stay of 4 days or less has the highest probability of a stay of 8 or more
days. In Figure 1, there are two cutpoints (or crossover points). The first occurs just beyond the 4-day
mark where clusters 2 and 10 crossover, with the lowest probability of a stay beyond 5 days. Cluster 4
also crosses over at that point. The second cutpoint occurs at 6 days where the remaining clusters switch
from lower to higher probabilities.
Note that the ordering in Figure 1 is not the same as it is when just using the mean. Since the mean
is unduly influenced by the presence of outliers, when the distributions are as highly skewed as they are
in Figure 2, it is better to use medians.
For total charges, 2<10<4<7<9<3<5<8<6<1. The distribution for total charges has an ordering that is
almost the same as it is for length of stay. There are also three cutpoints in Figure 2. The first occurs at
just over $10,000 when cluster 2 moves from the highest probability of a total charge of less than 10,000
to the lowest probability of a charge of greater than 10,000. The second cutpoint occurs for cluster ten
at approximately $15,000. The third cutpoint for the remaining clusters is at just over $20,000.
Because of the dominance of childbirth and delivery in two of the clusters, the results are not quite
as representative as they should be. Therefore, we want to re-cluster after first eliminating any patient
conditions that are related to childbirth. We also want to eliminate all newborn conditions, as they are
also related to childbirth. Therefore, we use SAS coding to remove from consideration all patients with
Search WWH ::

Custom Search