Information Technology Reference
In-Depth Information
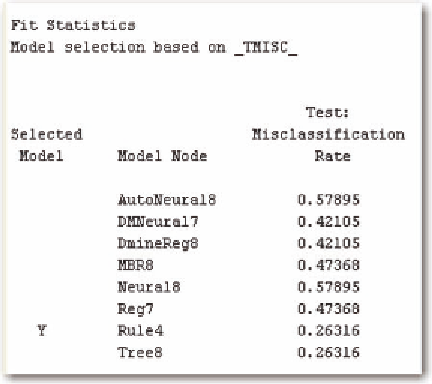
Figure 33. Results of prediction of mortaility
Figure 34. Decision tree to predict mortality
problem of robustness since providers can appear better or worse depending upon the measure used.
We now include the values of the Charlson Index and the APRDRG indices to the resource demand
levels to see if we can improve the predictions. As shown in Figure 35, Dmine regression provides the
best result with a very similar misclassification rate (21% versus 26%). The Dmine regression results
are in Figure 36.
The resource demand level for mortality has the most importance followed by the APRDRG indices.
The Charlson Index has lower importance compared to the hospitals. The results are in Tables 22 and
23. Again, note the similarity between the values in Table 17 for mortality level 5 and the predicted
values as listed in Table 22.
Notice that while the rank using all indices is similar to the one using just the resource demand levels,
there are still differences. We also examine the length of stay using all of the indices. The decision tree
is the optimal model, with average error as given in Figure 37. This average error is 46, or less than the
value of the mean. The decision tree is given in Figure 38.

Search WWH ::

Custom Search