Information Technology Reference
In-Depth Information
Figure 31. Results of predictive modeling
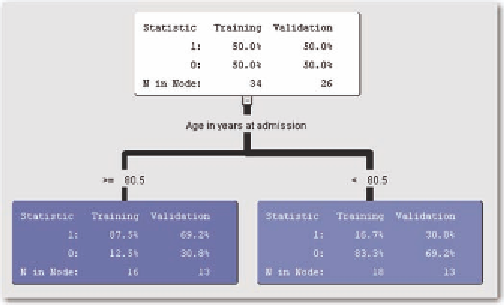
Figure 32. Decision tree model for predicting mortality
It is clear that predicted mortality of 55% and 85% is much too high to be useful. Table 12 compares the
rankings of the APRDRG indices to the disease staging levels defined in this chapter.
Note that the rankings are very different between the two sets of index measures. For the APRDRG
index, hospital #6 has the highest ranking; for the disease staging indices, hospital #3 has the highest
ranking. In addition, the demand staging has difficulty in separating providers, giving two of the providers
the same ranking. Table 12 again shows the lack of consistency across measures of patient severity.
We look to see how the disease staging measures compare with cardiovascular procedure 36.1.
Tables 13, 14, and 15 compare the severity measures to the procedure. Note that all of the patients are
in categories 3,4, and 5 for length of stay, indicating that this measure does recognize the more severe
level of these patients.
Approximately ¾ of these patients are in category 4, with procedures 3612-3614 having the highest
proportion in category 5. In Table 5, which focuses on mortality, the majority of patients are in category
3 rather than 4.

Search WWH ::

Custom Search