Information Technology Reference
In-Depth Information
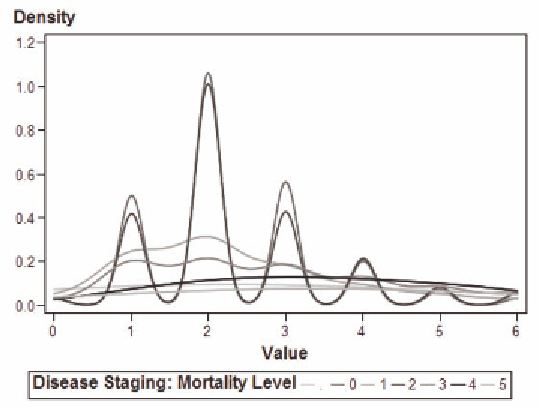
Figure 20. Length of stay by disease staging: mortality level
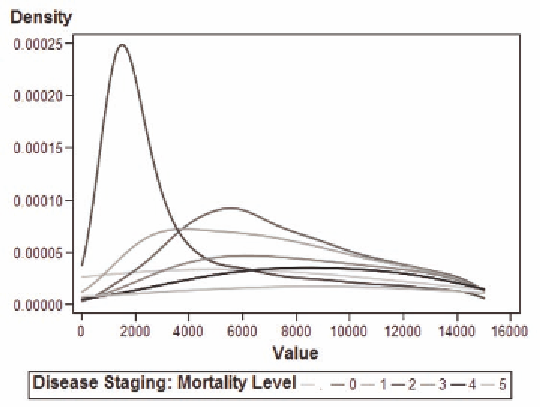
Figure 21. Total charges by disease staging: mortality level
levels. This is in direct contrast to the results using the mortality index that show that level two has the
highest probability of a low cost. It indicates that it is easier to “game” the mortality index than it is to
“game” the resource demand level. The next two graphs are restricted to levels 3 and higher.
Figure 26 shows that as the level increases, the probability of a stay of greater than ten days increases
while the probability of a stay of less than four days decreases as the level increases. However, the prob-
ability of a stay of between four and eight days is greater for level 4 than it is for level 5.
Figure 27 shows that the probability of costs less than $30,000 are generally less for level 5 than
for level 4; at some point beyond 30,000, the two curves will intersect. Of interest, however, is that the
Search WWH ::

Custom Search