Information Technology Reference
In-Depth Information
dIsease stagIng comPared to outcomes
We will look at the Disease Staging measures to see if they can be used to predict outcomes. Again, we use
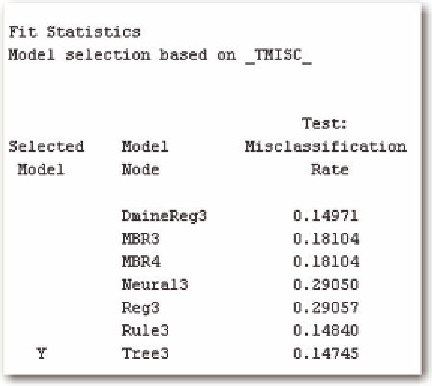
mortality, length of stay, and total charges. Figure 17 gives the results of a model predicting mortality.
It shows that the decision tree has the best model with just under a 15% misclassification rate. Figure
18 gives the decision tree. It shows that the disease staging: mortality divides the first branch followed
by disease staging: resource demand. Age is also important in the prediction of mortality.
The results have a smaller false negative rate compared to the false positive (Figure 19). When it
comes to predicting mortality, it is more important to predict the event accurately, so a smaller false
negative rate indicates a better model.
We also want to examine the results when predicting the length of stay and the total charges. To do
this, we first examine the kernel density estimators by disease staging: mortality level (Figures 20 and
21).
It is clear from both of these figures that there are far fewer patients in the lower levels compared to
the higher levels, as indicated by the amount of variability in the lower levels. It is particularly surprising
that a mortality level of 2 has the highest probability of a smaller charge compared to any of the other
levels. Such a result indicates upcoding into level 2. Therefore, we also show the graphs restricting at-
tention to levels 3-5 (Figures 22 and 23).
Figure 22 shows that levels 4 and 5 do, in fact, have a much higher probabililty of a length of stay
greater than 4 days, and have virtually the same probability of a stay of greater than 7 days. This shows that
the distinction in patient severity between levels 4 and 5 is not demonstrated in the patient outcomes.
However, when considering total charges, there is a clear distinction between levels 4 and 5, such
that level 4 has a higher probability of a cost between 0-$25,000 compared to level 5. It does show a
natural ordering of the levels as identified in the costs when limited to the last three levels and excludes
a comparison to levels 1 and 2.
We also want to examine the disease staging: resource demand levels. Figures 24 and 25 show the
kernel density estimate for the two outcomes of length of stay and total charges. Figures 24 and 25 have
Figure 17. Predictive modeling results for mortality
Search WWH ::

Custom Search