Information Technology Reference
In-Depth Information
Figure 9. Misclassification rate for model
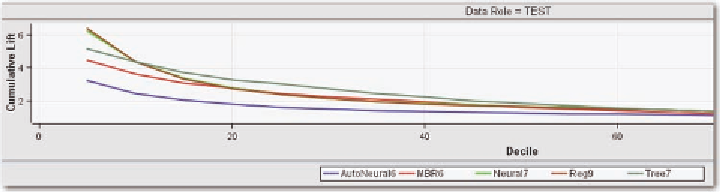
Figure 10. Lift function for model
comparison to the aPrdrg
Unlike the APRDRG coding, all patients can be classified using the patient utilization indices. Tables
6,7 give the relationship between the different indices.
In Table 6, note that almost 95% of patients from disease staging length of stay classes 1-2 are in
APRDRG class 1; 71% from class 3 are also in APRDRG class 1. Most of the patients are in class 1
because most of the patients are in APRDRG class 1. Patients in the most severe disease staging LOS
are in APRDRG class two 30% of the time, and in class 4 only 17% of the time. In fact, there are almost
twice as many patients in DS LOS class 5 compared to APRDRG class 4.
Table 7 gives the comparison of APRDRG mortality to disease staging mortality level. A similar
result occurs here, with slight shifts in classes. Over 95% of the patients in the first three disease staging
levels are in APRDRG class 1; 32% of the patients in disease staging level 5 are in APRDRG class 4.
This table indicates that far more patients are identified as least severe in the APRDRG index compared
to the disease staging indices.
We add the APRDRG mortality and severity indices to the predictive model to determine whether
multiple indices can predict the disease staging levels. Figure 12 gives the variable roles; Figure 13 gives
the misclassification rate, and Figure 14 gives the Lift function. The clear conclusion is that there is still
little ability for one index to predict another.

Search WWH ::

Custom Search