Information Technology Reference
In-Depth Information
Figure 20. Misclassification results
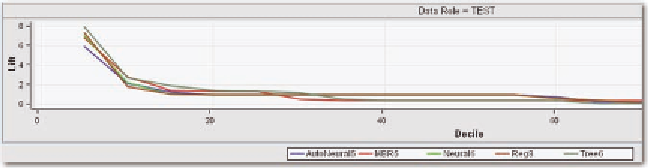
Figure 21. Lift function
Note that the decision tree starts branching in terms of pairs of Charlson values. If the Charlson Index
is equal to 0 or 1, the classification is primarily into APRDRG value 1. The next split shows that the
Charlson Index of 2 or 3 classifies almost 50% into APRDRG class 1 with most of the rest in class 2.
This branch was for patients less than 45 years of age and less than $51,000 in total charges. Figure 23
shows another branch of the tree.
Since the length of stay is already greater than 8.5 days, there are no patients identified as Charlson
Index 0. For a Charlson Index of 1 or 2, the APRDRG classification is evenly split between class 1 and
class 2; otherwise, the prediction is largely for class 2. The next split is determined by cost. For a length
of stay less than 8.5 days, but with a charge of greater than $45,000, a Charlson index of greater than
1 is split between APRDRG classes 2 and 3, with most in class 2. For a Charlson value of 0 or 1, the
prediction is split between APRDRG classes 1,2, and 3. Age in years is required for another split in the
prediction.
This decision model does indicate that the value of the Charlson Index can be compressed into
approximately 5 classes with values 5 and upward compressed into just one class of patient severity.
However, it also demonstrates that there is a problem with predicting the APRDRG index.

Search WWH ::

Custom Search