Information Technology Reference
In-Depth Information
While the distributions are similar compared to Figure 11, it is not until almost day 6 before class 3
has a higher probability compared to class 2. Therefore, for most of the patients, class 2 actually has the
higher probability of higher cost compared to class 3. It suggests that providers are successfully shifting
patients from class 2 into class 3.
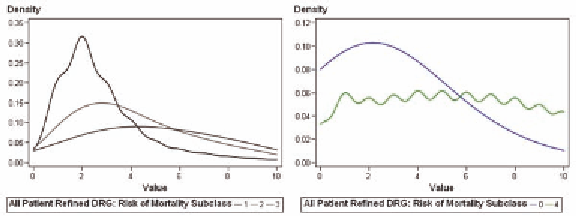
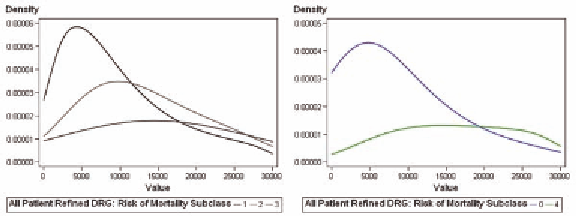
The shifting of patients from class 2 to class 3 is even more pronounced in the mortality index, with
class 2 having higher total charges until the $30,000 mark is reached.
comParIson to tHe cHarlson Index
We first want to make a comparison between the Charlson Index of the previous chapter and the APRDRG
index. There are two indices to consider; one for mortality and the other for patient severity. Table 5
compares the Charlson Index to the APRDRG mortality index.
The value of 0 for APRDRG indicates that an index value cannot be defined given the data, either
because the data are missing or because the values given are incorrect. Notice that for none of the Charl-
son levels does the majority of observations go into the most severe of the APRDRG levels. Charlson
levels of 0 and 1 correspond roughly to APRDRG level 1. Charlson levels of 2-5 mostly correspond to
APRDRG level 2 with the remaining Charlson levels corresponding largely to APRDRG level 3. How-
ever, if we try to predict one index from the other in a linear regression, the r
2
value is only 27%. We
also compare the Charlson Index to the APRDRG patient severity index (Table 6).
In Table 6, only the Charlson Index value 1 corresponds to the APRDRG index of 1. Charlson values
1-3 correspond to APRDRG index 2; APRDRG index 3 corresponds to Charlson values 4-12. Only the
Figure 13. Mortality index and length of stay
Figure 14. Mortality index and total charges
Search WWH ::

Custom Search