Information Technology Reference
In-Depth Information
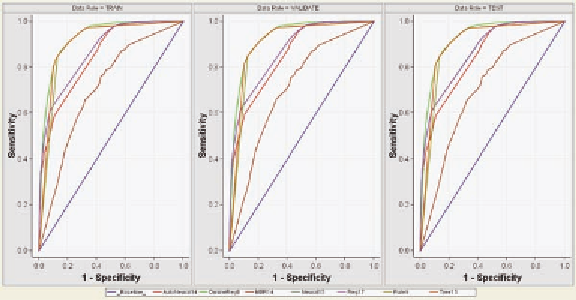
Figure 5. ROC curves for prediction of mortality
sets, with rule induction, decision tree, and dmine regression models showing very similar ROC curves.
The ROC curves show that the model predicts better than random chance.
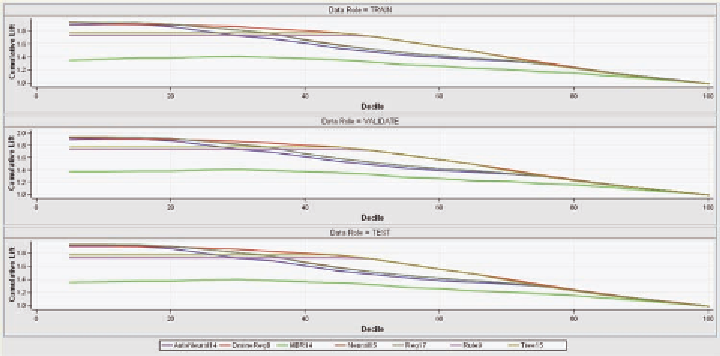
The lift curves show that the prediction is accurate to the sixth decile (Figure 6). The model does show
different rates of false positive to false negative values (Figure 7. It shows that the chosen models have
a much higer false negative rate compared to the models not chosen, which have a higher false positive
rate. This difference can be troubling since the false negative is the more critical statistic.
For this reason, we also provide a decision weight to make the false negative more costly compared
to the false positive rate (Figure 8).
The results suggest that the decision tree is the best model (Figure 9), with the tree given in Figure
10. Note that this tree is different compared to the one in Figure 2.
We next want to investigate length of stay and total charges in relationship to the APRDRG index.
We use kernel density estimation. The code to find these graphs is equal to
Figure 6. Lift function for prediction of mortality
Search WWH ::

Custom Search