Information Technology Reference
In-Depth Information
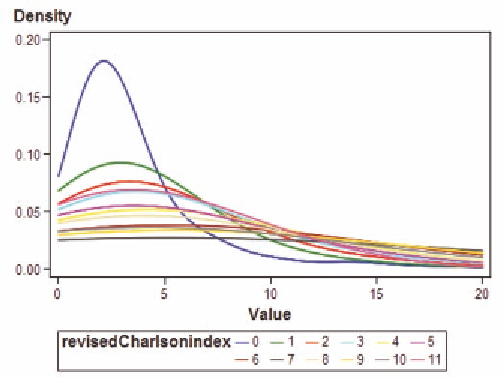
Figure 22. Probability density for length of stay for the D'Hoore Charlson index
Figure 23. Predicted mortality with risk adjustment by Charlson index
Ultimately, we want to compare the predicted and actual values by hospital. Table 28 lists these values,
and the difference for ranking purposes. We use the same list of hospitals as were used in Chapter 4.
This table is in fact identical to Table 12 defined in Chapter 4 using a number of diagnosis and
procedure indicator functions. This is not unexpected since the Charlson Index was defined using the
diagnosis codes in the indicator functions listed in the previous chapter.
In our next example, we limit the patients to those undergoing procedure 36.1, and use the list of ten
hospitals that do perform cardiovascular bypass surgery.
We first want to examine the relationship between procedure and Charlson Index. Table 29 compares
the Index to each of the procedures. Note that even though every one of the patients has serious heart
conditions that require bypass surgery, there are still some patients with a code of 0 in the index; none
Search WWH ::

Custom Search