Information Technology Reference
In-Depth Information
Again, the pattern is almost totally linear with an increase for every index level. Figure 17 gives the
probability density for a New Index of 0. It shows a very sharp peak at a length of stay of approximately
2 days with smaller peaks at 1 and 3 days. The probability of a stay beyond 5 days is virtually zero.
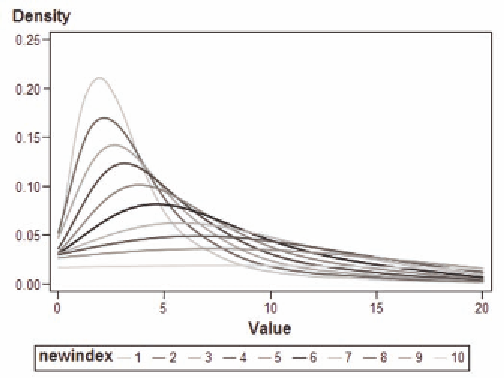
Figure 18 gives the length of stay distribution for an index of 1-10.
The pattern displayed is again very regular, showing a similar change in magnitude from one index
level to the next. Table 23 compares the two indices directly. It appears that this new index gives a bet-
ter result generally; it is not yet known how well it will work with new data. However, NIS data from a
previous year can be used to demonstrate reliability in the Index.
Table 22 shows that there is no real correspondence between the two indices. For example, while 62%
of the Charlson Index values also have zero value for the new index, fully 20% are shifted to new index
Figure 17. Length of stay for new index zero
Figure 18. Length of stay for new index 1-10

Search WWH ::

Custom Search