Information Technology Reference
In-Depth Information
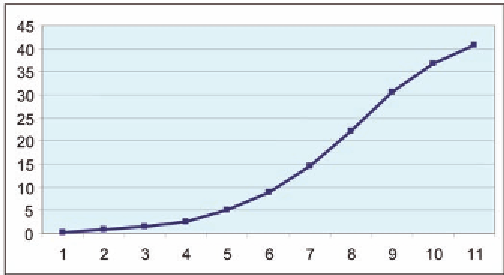
Figure 13. Mortality by new index
Table 22. Length of stay and total charges by new index
newindex
N Obs
Variable
Mean
Std Dev
Minimum
Maximum
N
0
3129583
LOS
TOTCHG
3.2428094
12302.79
5.4167516
23539.62
0
25.0000000
364.0000000
999710.00
3129525
3066669
1
1431567
LOS
TOTCHG
4.2416399
21116.97
6.5166212
32688.84
0
25.0000000
364.0000000
998317.00
1431473
1411635
2
1241687
LOS
TOTCHG
4.8663472
25750.44
6.5674068
37562.91
0
25.0000000
365.0000000
997707.00
1241575
1224680
3
983962
LOS
TOTCHG
5.6671874
29850.70
7.1677542
44159.59
0
25.0000000
365.0000000
999926.00
983872
970517
4
642297
LOS
TOTCHG
6.7287520
34921.58
8.2115352
53050.54
0
27.0000000
361.0000000
999720.00
642250
633893
5
346270
LOS
TOTCHG
7.9652441
41731.68
9.3912188
63744.23
0
28.0000000
341.0000000
998554.00
346243
341986
6
151208
LOS
TOTCHG
9.2747138
49817.70
10.5047496
73879.86
0
29.0000000
308.0000000
997836.00
151201
149465
7
52635
LOS
TOTCHG
10.4419851
57487.55
11.4814388
79616.93
0
64.0000000
282.0000000
997590.00
52633
52103
8
13541
LOS
TOTCHG
11.3076582
63405.66
12.4802009
86361.05
0
29.0000000
268.0000000
944763.00
13541
13419
9
2131
LOS
TOTCHG
11.7550446
67360.56
13.0429794
87828.53
0
244.0000000
197.0000000
737108.00
2131
2111
10
167
LOS
TOTCHG
13.9221557
79270.05
16.2343508
108184.58
0
2055.00
127.0000000
693193.00
167
167
Since mortality was used to define the index, we want to validate it by comparing length of stay to total
charges (Table 22). Unlike the Charlson Index, the values increase as the New Index level increases. This
is depicted graphically in Figures 14 and 15 for total charges and in Figures 16-18 for length of stay.
Note that the increase by the New Index level is almost completely linear. The kernel density in
Figure 15 shows that the transition from one index level to another is very regular compared to the
transitions of the Charlson Index. The transition from one Index level to another is very smooth with
very natural cutpoints.


Search WWH ::

Custom Search