Information Technology Reference
In-Depth Information
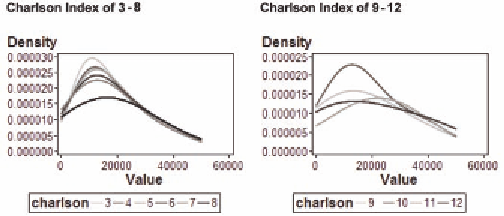
Figure 9. Probability density for total charges for Charlson index of 3-12
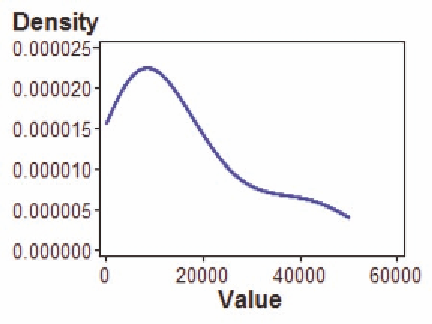
Figure 10. Probability density for total charges for Charlson index of 13
One way of eliminating these discrepancies is to define a cutpoint. Often that cutpoint is defined at
index 2 or 3, so that all patients with an index of 2 or less are given a code of 0; all others are given a code
of 1. We use the code to define a cutpoint at 2. Table 13 gives the resulting relationship to mortality.
Table 13. Mortality by Charlson code with a cutpoint at 2
Table of charlsoncode by DIED
charlsoncode
DIED
Total
Frequency
Row Pct
Col Pct
0
1
0
7061154
98.44
90.24
112018
1.56
67.02
7173172
1
763703
93.27
9.76
55132
6.73
32.98
818835
Total
7824857
167150
7992007


Search WWH ::

Custom Search