Information Technology Reference
In-Depth Information
probability. Index 10 follows the pattern with a first peak at 3.9 and a crossover at day 7.5. However,
the second crossover occurs at day 13.3. Index 11 has just one peak at day 7.2; Index 12 has two peaks,
one at day 2.25 and a second at day 10.8 with a crossover at day 15.6. Figure 7 gives the probability
density for a Charlson Index of 13.
For index 13, the peak value occurs at day 4.15, again, indicating that HIV is now over-weighted in
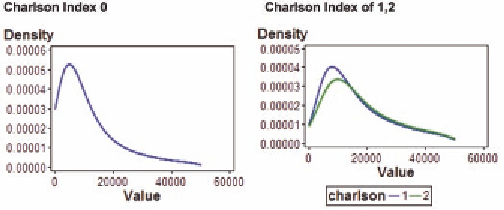
the model. We show the similar distributions for total charges. Figure 8 gives the probability functions
for indices 0-2.
The peak for index 0 occurs at $8625. It is at $8000 for index value 1 and at $9875 for index 2. There
is a crossover point between 1 and 2 at $14,500. These values indicate ambiguity between code 0 and
code 1 in terms of charges. Figure 9 gives the Index values for 3-12.
The pattern for indices 3-8 is fairly regular with peak values of $10,750<$11,500<$12,125<$12,7
50=$12,750<$16,375 as the index increases from 3 to 8. In addition, there is a crossover point for all
indices at $27,375. However, there is no regular pattern for indices 9-12 with a peak of $12,750 for
index 9, which is much lower than the $16,375 for index 8. While the peak for index 10 is $13,750, it
decreases to a peak of $12,750 before increasing to $25,125 for index 12. The crossover point between
index 10 and 11 occurs at $30,375. Figure 10 has the Charlson Index of 13.
For index 13, the peak occurs at $8750, which is very close to what it is for index zero.
Figure 7. Probability density for Charlson index 13
Figure 8. Probability density for total charges for Charlson index of 0-2

Search WWH ::

Custom Search