Information Technology Reference
In-Depth Information
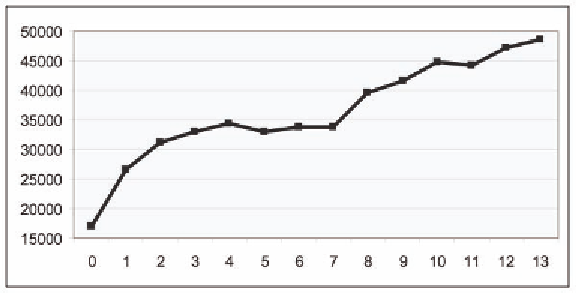
Figure 3. Average length of stay by Charlson index value
Figure 4. Total charges by Charlson index value
index should be examined for its predictive ability to see if decisions on patient care can be based upon
prediction, or whether the quality of care can be measured by comparing actual to predicted values.
(Birim et al., 2003; Matteo et al., 2007; McGregor et al., 2005; Rius et al., 2004; Senni et al., 2006; Volk,
Hernandez, Lok, & Marrero, 2007) It is clear that the Index cannot be truly predictive unless it can ac-
curately predict the outcomes of incoming patients; statistical significance alone is not sufficient.
We next look to the length of stay and total charges as outcomes. Table 12 gives basic summary
statistics. Again, we should expect the average value to increase as the Charlson index value increases.
Unfortunately, this is not the case. In addition, the magnitude of the difference from one Charlson value
to the next is not consistent.
Using just a 10% random sample, we drill down into the data to examine the entire distribution of
length of stay with the following code. Proc KDE estimates the entire population distribution. In this
example, we write multiple Proc KDE procedures so that we can view a partial list of indices on the
same graph.
proc kde
data=nis.charlsonsample;
univar los/gridl=
0
gridu=
20
out=nis.kdelos3 method=srot bwm=
4
;

Search WWH ::

Custom Search