Information Technology Reference
In-Depth Information
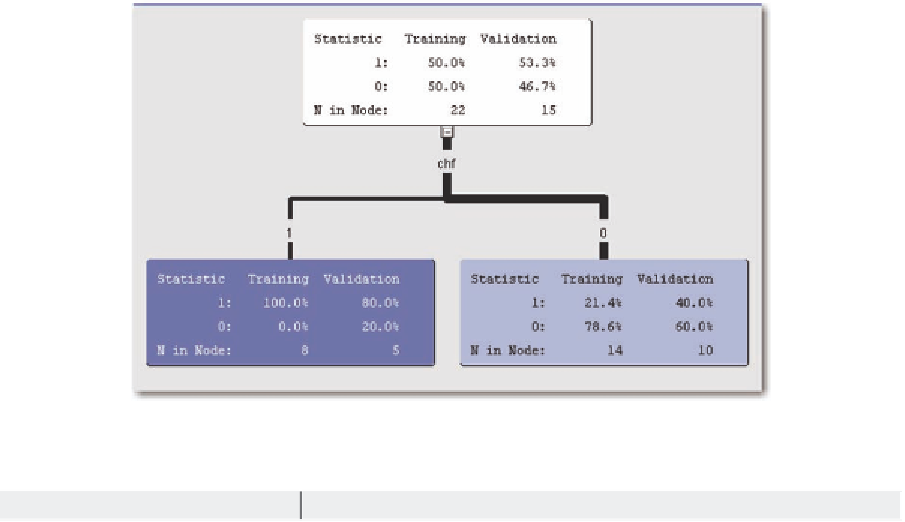
Figure 39. Decision tree to predict mortality for patients undergoing cardiovascular bypass surgery
Table 16. Percent of predicted versus actual mortality by procedure
Procedure
Actual Mortality
Predicted Mortality
3610
2.78
42.59
3611
2.78
42.36
3612
2.49
39.55
3613
1.14
39.02
3614
1.07
40.53
3615
0
32.14
3616
0
32.14
3617
0
0
3619
0
100
univar totchg/gridl=
20000
gridu=
100000
out=nis.kdecardchg bwm=
.9
;
by pr1;
run
;
Figure 40 shows the length of stay by hospital. As shown in Table 18, stay differed considerably by
procedure. It also differs considerably by hospital. Hospital #6 has the greatest probability of a shorter
length of stay compared to the other hospitals. Hospital #2 has the highest probability of a longer length
of stay. Hospital #7 tends to be in the middle in probability for both a high and low length of stay, as
does hospital #1.
Figure 41 shows the total charges compared to hospital. There is a definite shift in the curves, indi-
cating that some hospitals charge far more compared to other hospitals, especially hospitals #3 and #9.
Hospital #1 has the least charges, reinforcing the fact that it more generally performs a procedure that


Search WWH ::

Custom Search